

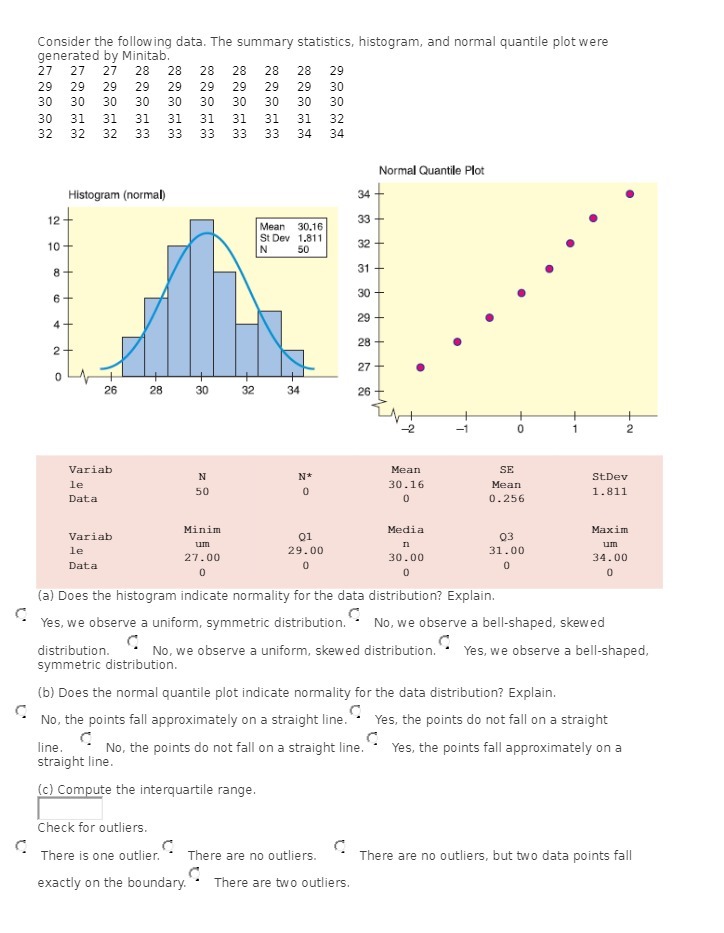
Question: Consider the following data. The summary statistics, histogram, and normal quantile plot were generated by Minitab. 27 27 27 28 28 28 28 29 29
Step by Step Solution
There are 3 Steps involved in it
1 Expert Approved Answer
Step: 1 Unlock

Question Has Been Solved by an Expert!
Get step-by-step solutions from verified subject matter experts
Step: 2 Unlock
Step: 3 Unlock