

Question: Consider the following dataset with a single feature x , and corresponding true label values y are shown in the table below [ 1 6
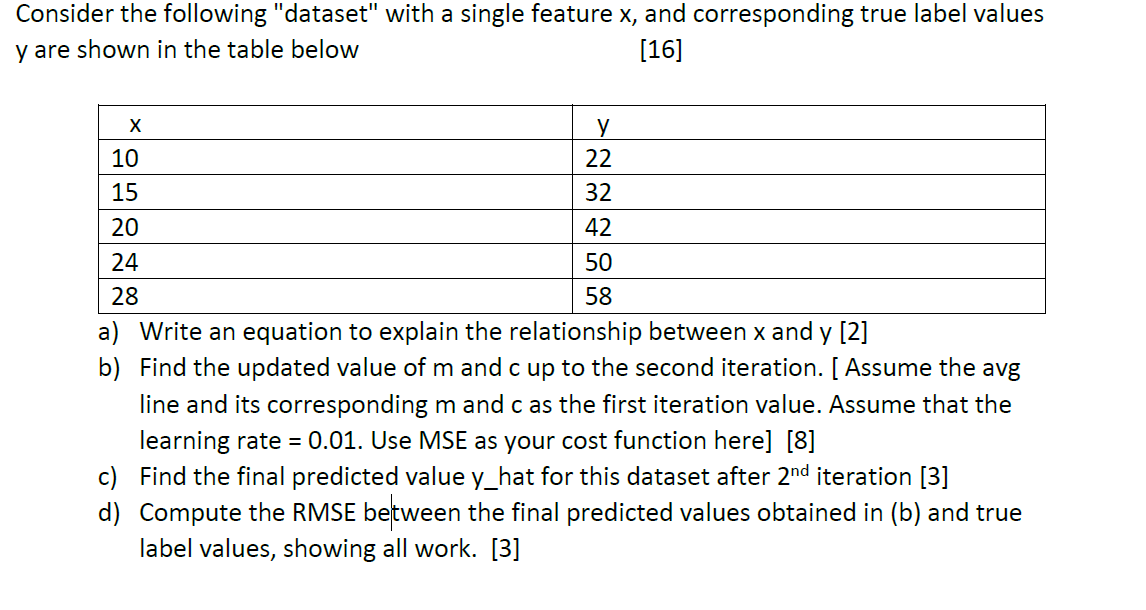
Consider the following "dataset" with a single feature x and corresponding true label values
y are shown in the table below
a Write an equation to explain the relationship between x and y
b Find the updated value of m and c up to the second iteration. Assume the avg
line and its corresponding m and c as the first iteration value. Assume that the
learning rate Use MSE as your cost function here
c Find the final predicted value yhat for this dataset after nd iteration
d Compute the RMSE between the final predicted values obtained in b and true
label values, showing all work.
Solve the problem by showing all the steps.
Step by Step Solution
There are 3 Steps involved in it
1 Expert Approved Answer
Step: 1 Unlock

Question Has Been Solved by an Expert!
Get step-by-step solutions from verified subject matter experts
Step: 2 Unlock
Step: 3 Unlock