

Question: Consider the following EVIEWS output for monthly data from 1990 to 2008 on US petrol consumption, prices, income etc. The variables are defined as LPETCONS_G
Consider the following EVIEWS output for monthly data from 1990 to 2008 on US petrol consumption, prices, income etc.
The variables are defined as
LPETCONS_G = Natural Log Petrol Consumption per head (Gallons)
LRPETPRICE = Natural Log Real Average Monthly Petrol Price Per Gallon
LRINCOME = Natural Log Real Monthly US Income per head
D_SPRING - Dummy= 1 when month = March, April, May , (0 otherwise)
D_SUMMER - Dummy= 1 when month = June, July, August, (0 otherwise)
D_AUTUMN - Dummy= 1 when month = September, October, November, (0 otherwise)
- Carefully interpret and discuss the Eviews regression output and regression model of the petrol consumption?
- You should also state your opinion as an analyst of the company producing or selling petrol
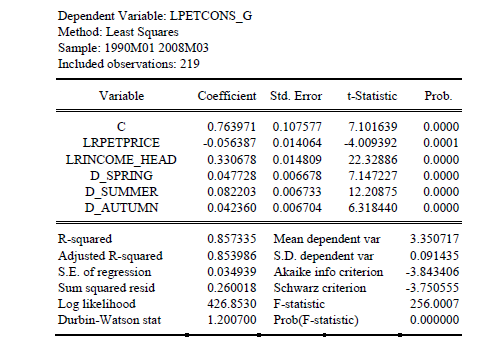
Dependent Variable: LPETCONS G Method: Least Squares Sample: 1990M01 2008M03 Included observations: 219 Variable Coefficient Std. Error t-Statistic Prob. C 0.763971 0.107577 7.101639 0.0000 LRPETPRICE -0.056387 0.014064 -4.009392 0.0001 LRINCOME HEAD 0.330678 0.014809 22.32886 0.0000 D SPRING 0.047728 0.006678 7.147227 0.0000 D SUMMER 0.082203 0.006733 12.20875 0.0000 D AUTUMN 0.042360 0.006704 6.318440 0.0000 R-squared 0.857335 Mean dependent var 3.350717 Adjusted R-squared 0.853986 S.D. dependent var 0.091435 S.E. of regression 0.034939 Akaike info criterion -3.843406 Sum squared resid 0.260018 Schwarz criterion -3.750555 Log likelihood 426.8530 F-statistic 256.0007 Durbin-Watson stat 1.200700 Prob(F-statistic) 0.000000
Step by Step Solution
There are 3 Steps involved in it

Get step-by-step solutions from verified subject matter experts