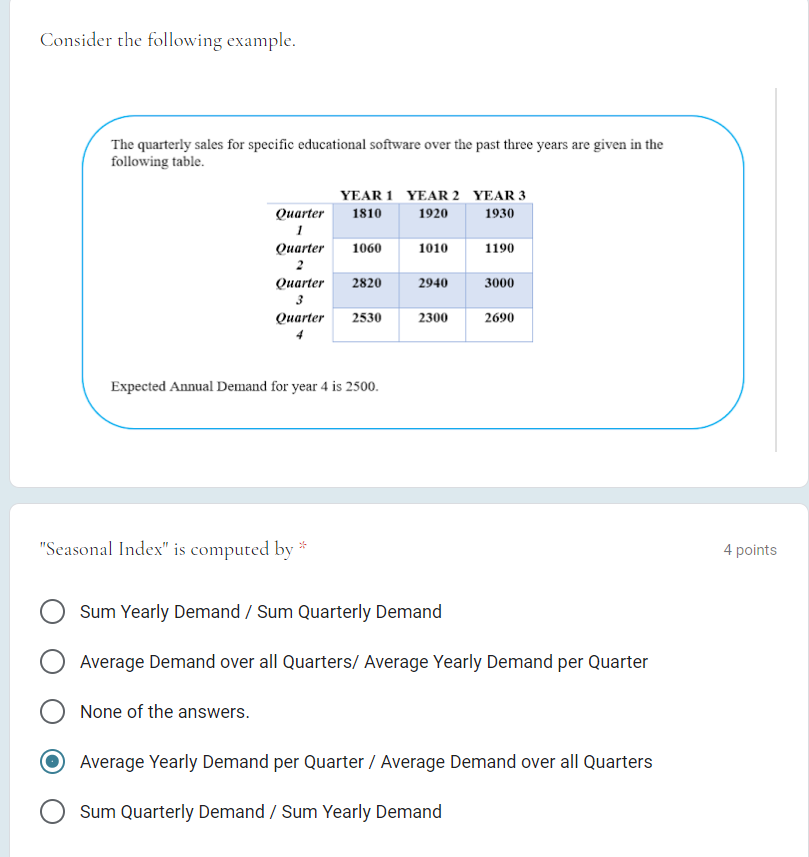
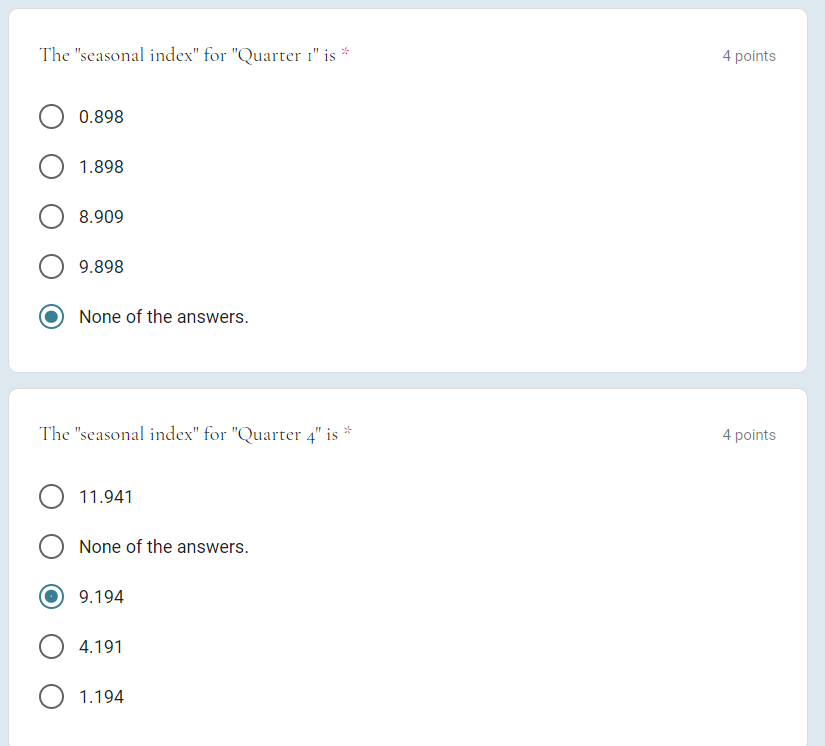
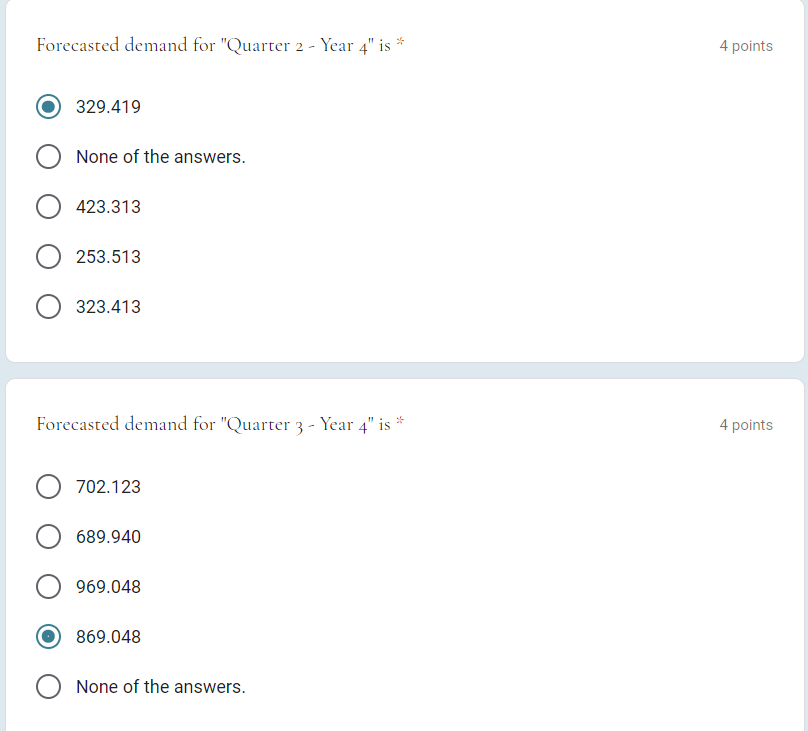
Question: Consider the following example. The quarterly sales for specific educational software over the past three years are given in the following table. YEAR 1 YEAR

Consider the following example. The quarterlyConsider the following example. The quarterlyConsider the following example. The quarterly

Consider the following example. The quarterly sales for specific educational software over the past three years are given in the following table. YEAR 1 YEAR 2 YEAR 3 1810 1920 1930 1060 1010 1190 Quarter 1 Quarter 2 Quarter 3 Quarter 2820 2940 3000 2530 2300 2690 Expected Annual Demand for year 4 is 2500. "Seasonal Index" is computed by 4 points Sum Yearly Demand / Sum Quarterly Demand Average Demand over all Quarters/ Average Yearly Demand per Quarter None of the answers. Average Yearly Demand per Quarter / Average Demand over all Quarters Sum Quarterly Demand / Sum Yearly Demand The "seasonal index" for "Quarter 1" is * 4 points 0.898 O 1.898 8.909 9.898 None of the answers. 25 The "seasonal index" for "Quarter 4" is 4 points 11.941 None of the answers. 9.194 4.191 O 1.194 Forecasted demand for "Quarter 2 - Year 4" is * 4 points 329.419 None of the answers. 423.313 253.513 323.413 Forecasted demand for "Quarter 3 - Year 4" is * 4 points 702.123 689.940 969.048 869.048 None of the answers

Step by Step Solution

There are 3 Steps involved in it

1 Expert Approved Answer
Step: 1 Unlock blur-text-image
Question Has Been Solved by an Expert!

Get step-by-step solutions from verified subject matter experts

Step: 2 Unlock
Step: 3 Unlock

Students Have Also Explored These Related General Management Questions!