

Question: Consider the following financial statement data for Hi-Tech Instruments: For the Year Ended December 31 (Thousands of Dollars, except Earnings per Share) $214,000 129,000
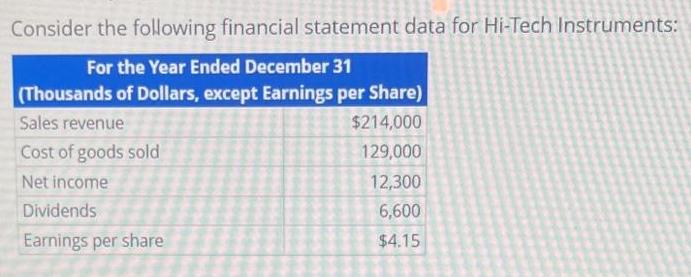
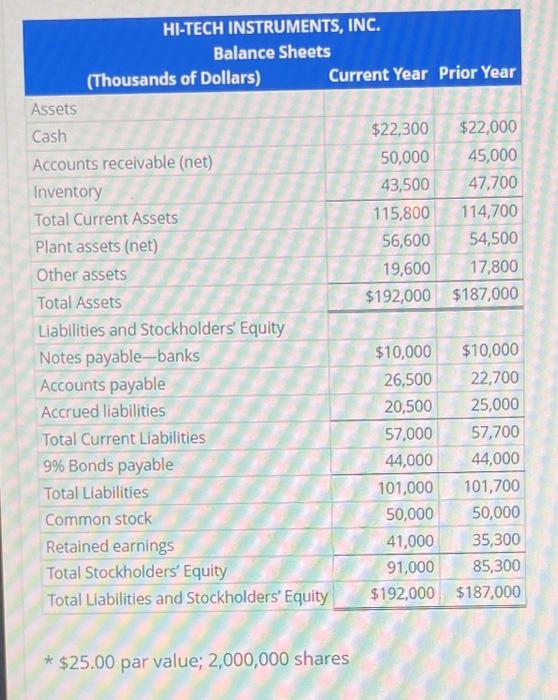
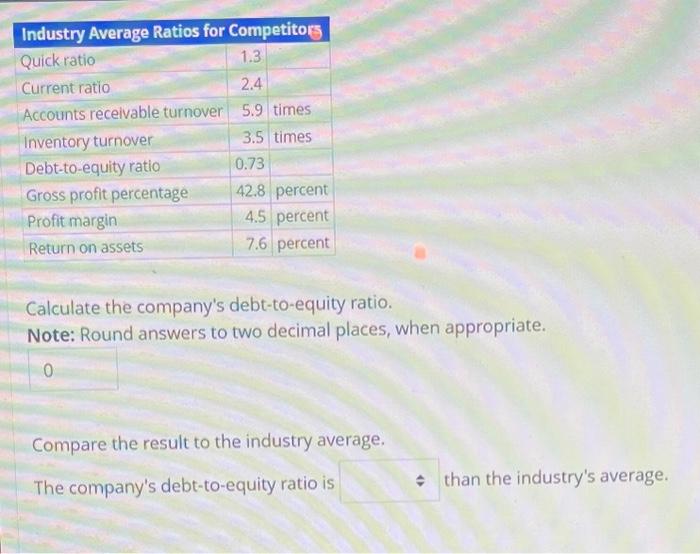
Consider the following financial statement data for Hi-Tech Instruments: For the Year Ended December 31 (Thousands of Dollars, except Earnings per Share) $214,000 129,000 12,300 6,600 $4.15 Sales revenue Cost of goods sold Net income Dividends Earnings per share Assets Cash HI-TECH INSTRUMENTS, INC. Balance Sheets (Thousands of Dollars) Accounts receivable (net) Inventory Total Current Assets Plant assets (net) Other assets Total Assets Liabilities and Stockholders' Equity Notes payable-banks Accounts payable Accrued liabilities Total Current Liabilities 9% Bonds payable Total Liabilities Current Year Prior Year $22,300 $22,000 50,000 45,000 43,500 47,700 115,800 114,700 56,600 54,500 19,600 17,800 $192,000 $187,000 * $25.00 par value; 2,000,000 shares $10,000 26,500 20,500 57,000 44,000 101,000 Common stock 50,000 Retained earnings 41,000 Total Stockholders' Equity 91,000 Total Liabilities and Stockholders' Equity $192,000 $10,000 22,700 25,000 57,700 44,000 101,700 50,000 35,300 85,300 $187,000 Industry Average Ratios for Competitors Quick ratio Current ratio Accounts receivable turnover Inventory turnover Debt-to-equity ratio Gross profit percentage. Profit margin Return on assets 1.3 2.4 5.9 times 3.5 times 0.73 42.8 percent 4.5 percent 7.6 percent Calculate the company's debt-to-equity ratio. Note: Round answers to two decimal places, when appropriate. 0 Compare the result to the industry average. The company's debt-to-equity ratio is than the industry's average.
Step by Step Solution
3.32 Rating (152 Votes )
There are 3 Steps involved in it
Debt Equity ratio can be calculated as Total Liabilities ... View full answer

Get step-by-step solutions from verified subject matter experts