

Question: Consider the following graphs, where the left plot is the likelihood fx|0(x 0), and the right plot is the prior fe(0). The random variable
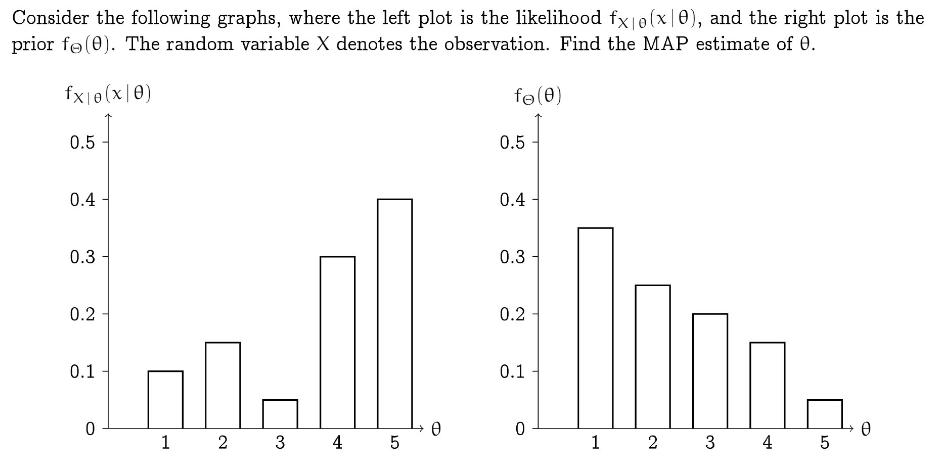
Consider the following graphs, where the left plot is the likelihood fx|0(x 0), and the right plot is the prior fe(0). The random variable X denotes the observation. Find the MAP estimate of 0. fx|0(x0) 0.5 0.4 0.3 0.2 0.1 0 1 2 3 4 5 0 fe (0) 0.5 0.4 D 1 0.3 0.2 0.1 0 2 3 SH 4 5 O
Step by Step Solution
★★★★★
3.44 Rating (154 Votes )
There are 3 Steps involved in it
1 Expert Approved Answer
Step: 1 Unlock

Thus... View full answer
Question Has Been Solved by an Expert!
Get step-by-step solutions from verified subject matter experts
Step: 2 Unlock
Step: 3 Unlock