

Question: Consider the following historical performance data for two different portfolios, the Standard and Poor's 500, and the 90-day T-bill. Consider the following historical performance data
Consider the following historical performance data for two different portfolios, the Standard and Poor's 500, and the 90-day T-bill.

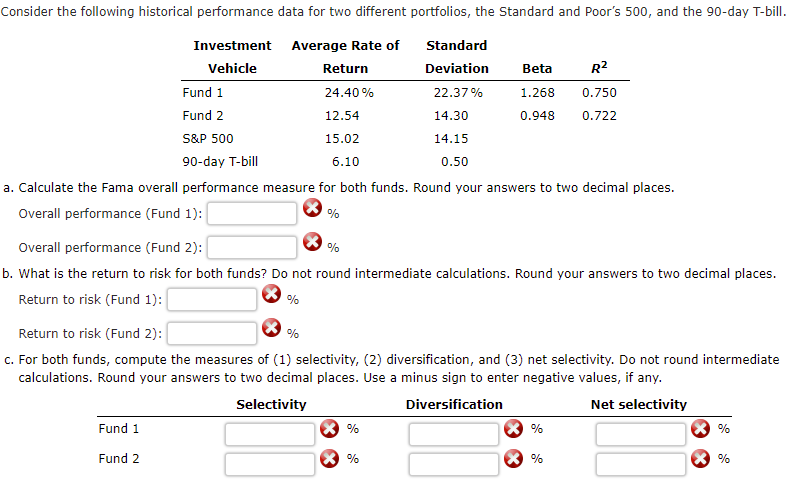
Consider the following historical performance data for two different portfolios, the Standard and Poor's 500, and the 90-day T-bill. Investment Average Rate of Standard Vehicle Return Deviation Beta R2 Fund 1 24.40% 22.37% 1.268 0.750 Fund 2 12.54 14.30 0.948 0.722 S&P 500 15.02 14.15 90-day T-bill 6.10 0.50 a. Calculate the Fama overall performance measure for both funds. Round your answers to two decimal places. Overall performance (Fund 1): Overall performance (Fund 2): % b. What is the return to risk for both funds? Do not round intermediate calculations. Round your answers to two decimal places. Return to risk (Fund 1): Return to risk (Fund 2): c. For both funds, compute the measures of (1) selectivity, (2) diversification, and (3) net selectivity. Do not round intermediate calculations. Round your answers to two decimal places. Use a minus sign to enter negative values, if any. Selectivity Diversification Net selectivity Fund 1 Fund 2
Step by Step Solution
There are 3 Steps involved in it

Get step-by-step solutions from verified subject matter experts