

Question: Consider the following hypothesis statement using or: 0.10 and data from two independent samples. Assume the population variances are not equal and the populations are
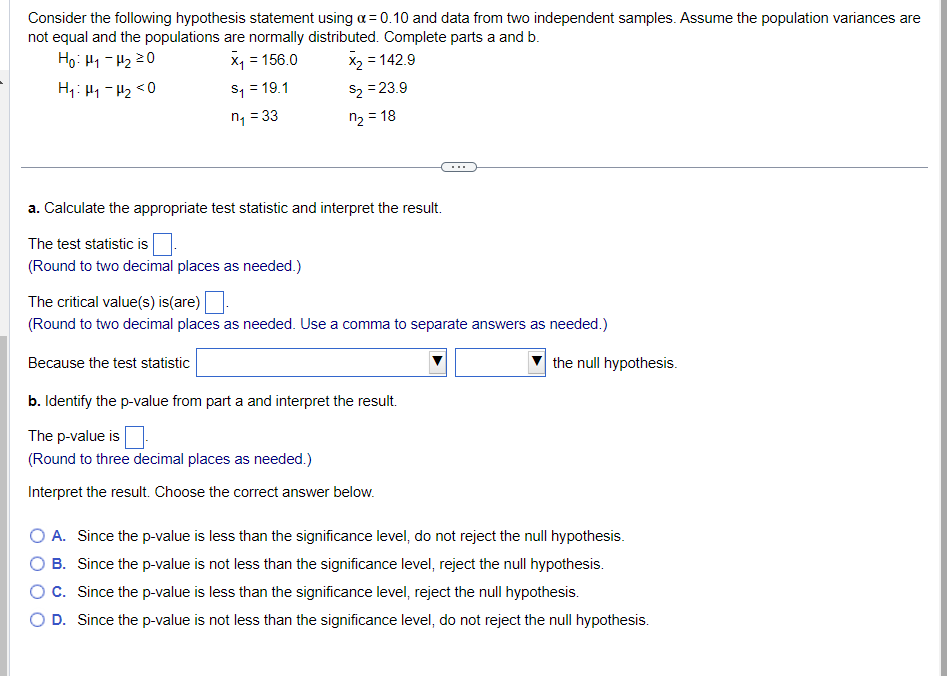

Consider the following hypothesis statement using or: 0.10 and data from two independent samples. Assume the population variances are not equal and the populations are normally distributed. Complete parts a and b. \"03 \"1 112 '30 i1 2156.0 {(2 21423 H1:\"1_\"2':0 51:19.1 52:23.9 H1233 H2318 a. Calculate the appropriate test statistic and interpret the result. The test statistic is (Round to two decima places as needed.) The critical value[s is(are} D. (Round to two decima places as needed. Use a comma to separate answers as needed.) Because the test statistic Y Y the null hypothesis. b. Identify the pvalue from part a and interpret the result. The p-value is D. (Round to three decimal places as needed.) Interpret the result. Choose the correct answer below. . Since the pvalue is less than the signicance level: do not reject the null hypothesis. A i: B. Since the p-value is not less than the signicance level, reject the null hypothesis. C. Since the pvalue is less than the signicance level; reject the null hypothesis. D {If . Since the pvalue is not less than the signicance level, do not reject the null hypothesis
Step by Step Solution
There are 3 Steps involved in it

Get step-by-step solutions from verified subject matter experts