

Question: Consider the following performance data for two portfolio managers (A and B) and a common benchmark portfolio: MANAGER A BENCHMARK Weight Return Weight Return
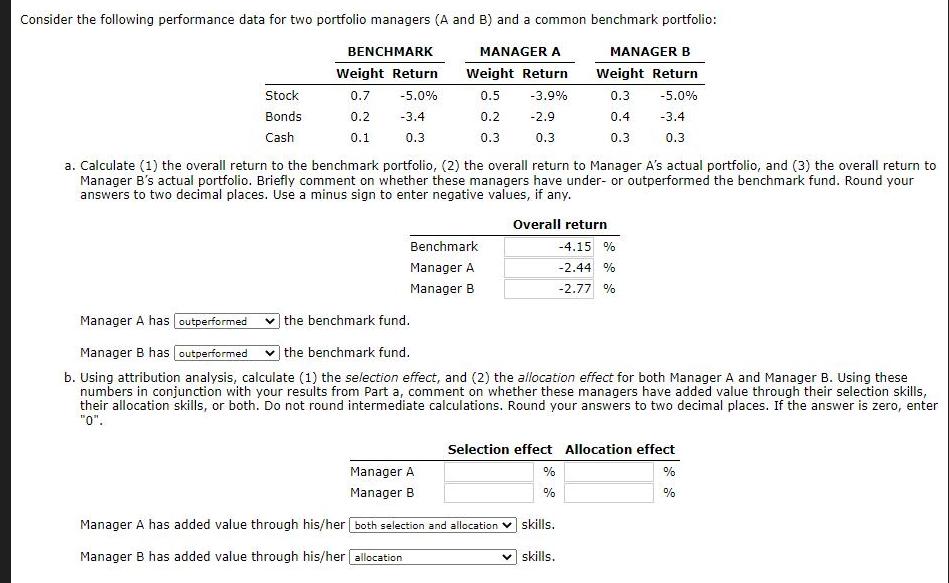
Consider the following performance data for two portfolio managers (A and B) and a common benchmark portfolio: MANAGER A BENCHMARK Weight Return Weight Return MANAGER B Weight Return Stock 0.7 -5.0% 0.5 -3.9% 0.3 -5.0% Bonds Cash 0.2 -3.4 0.2 -2.9 0.4 -3.4 0.1 0.3 0.3 0.3 0.3 0.3 a. Calculate (1) the overall return to the benchmark portfolio, (2) the overall return to Manager A's actual portfolio, and (3) the overall return to Manager B's actual portfolio. Briefly comment on whether these managers have under- or outperformed the benchmark fund. Round your answers to two decimal places. Use a minus sign to enter negative values, if any. Overall return Benchmark Manager A Manager B -4.15 % -2.44 % -2.77 % Manager A has outperformed the benchmark fund. the benchmark fund. Manager B has outperformed b. Using attribution analysis, calculate (1) the selection effect, and (2) the allocation effect for both Manager A and Manager B. Using these numbers in conjunction with your results from Part a, comment on whether these managers have added value through their selection skills, their allocation skills, or both. Do not round intermediate calculations. Round your answers to two decimal places. If the answer is zero, enter "0". Selection effect Allocation effect Manager A Manager B % % % % Manager A has added value through his/her both selection and allocation skills. Manager B has added value through his/her allocation skills.
Step by Step Solution
There are 3 Steps involved in it

Get step-by-step solutions from verified subject matter experts