

Question: Consider the following project for which you have been given the following data. begin{tabular}{|c|c|c|c|c|} hline Task & Duration (Weeks) & Optimistic & Most Likely &
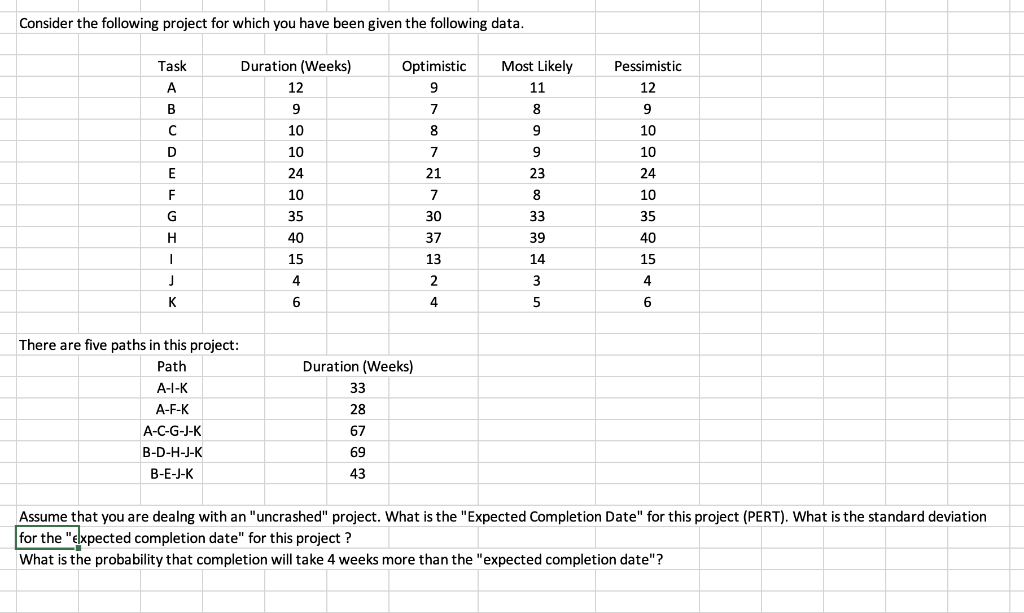
Consider the following project for which you have been given the following data. \begin{tabular}{|c|c|c|c|c|} \hline Task & Duration (Weeks) & Optimistic & Most Likely & Pessimistic \\ \hline A & 12 & 9 & 11 & 12 \\ \hline B & 9 & 7 & 8 & 9 \\ \hline C & 10 & 8 & 9 & 10 \\ \hline D & 10 & 7 & 9 & 10 \\ \hline E & 24 & 21 & 23 & 24 \\ \hline F & 10 & 7 & 8 & 10 \\ \hline G & 35 & 30 & 33 & 35 \\ \hline H & 40 & 37 & 39 & 40 \\ \hline I & 15 & 13 & 14 & 15 \\ \hline J & 4 & 2 & 3 & 4 \\ \hline K & 6 & 4 & 5 & 6 \\ \hline \end{tabular} There are five paths in this project: \begin{tabular}{|c|c|} \hline Path & Duration (Weeks) \\ \hline A-I-K & 33 \\ \hline A-F-K & 28 \\ \hline A-C-G-J-K & 67 \\ \hline B-D-H-J-K & 69 \\ \hline B-E-J-K & 43 \\ \hline \end{tabular} Assume that you are dealng with an "uncrashed" project. What is the "Expected Completion Date" for this project (PERT). What is the standard deviation for the "expected completion date" for this project? What is the probability that completion will take 4 weeks more than the "expected completion date"? Consider the following project for which you have been given the following data. \begin{tabular}{|c|c|c|c|c|} \hline Task & Duration (Weeks) & Optimistic & Most Likely & Pessimistic \\ \hline A & 12 & 9 & 11 & 12 \\ \hline B & 9 & 7 & 8 & 9 \\ \hline C & 10 & 8 & 9 & 10 \\ \hline D & 10 & 7 & 9 & 10 \\ \hline E & 24 & 21 & 23 & 24 \\ \hline F & 10 & 7 & 8 & 10 \\ \hline G & 35 & 30 & 33 & 35 \\ \hline H & 40 & 37 & 39 & 40 \\ \hline I & 15 & 13 & 14 & 15 \\ \hline J & 4 & 2 & 3 & 4 \\ \hline K & 6 & 4 & 5 & 6 \\ \hline \end{tabular} There are five paths in this project: \begin{tabular}{|c|c|} \hline Path & Duration (Weeks) \\ \hline A-I-K & 33 \\ \hline A-F-K & 28 \\ \hline A-C-G-J-K & 67 \\ \hline B-D-H-J-K & 69 \\ \hline B-E-J-K & 43 \\ \hline \end{tabular} Assume that you are dealng with an "uncrashed" project. What is the "Expected Completion Date" for this project (PERT). What is the standard deviation for the "expected completion date" for this project? What is the probability that completion will take 4 weeks more than the "expected completion date
Step by Step Solution
There are 3 Steps involved in it

Get step-by-step solutions from verified subject matter experts