

Question: Consider the following set of processes. table [ [ Process , Arrival Time ( ns ) , CPU / Processing Time ( ns )
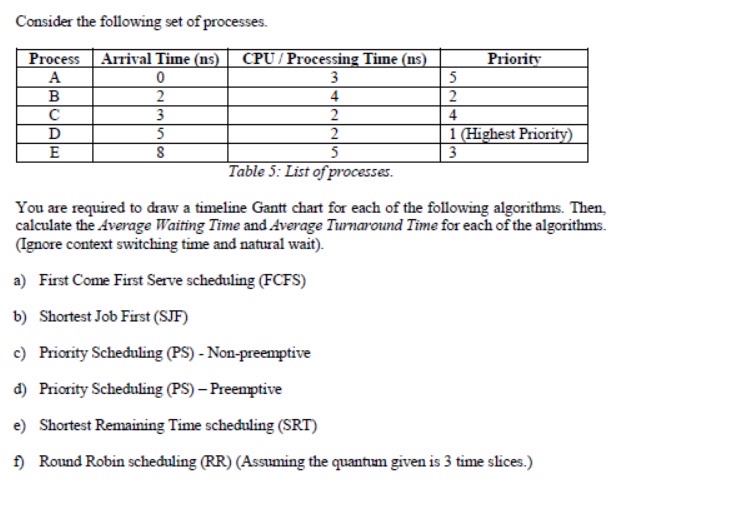
Consider the following set of processes.
tableProcessArrival Time nsCPU Processing Time nsPriorityABCDHighest PriorityE
Table : List of processes.
You are required to draw a timeline Gantt chart for each of the following algorithms. Then, calculate the Average Waiting Time and Average Turnaround Time for each of the algorithms. Ignore context switching time and natural wait
a First Come First Serve scheduling FCFS
b Shortest Job First SJF
c Priority Scheduling PS Nonpreemptive
d Priority Scheduling PS Preemptive
e Shortest Remaining Time scheduling SRT
f Round Robin scheduling RRAssuming the quantum given is time slices.
Step by Step Solution
There are 3 Steps involved in it
1 Expert Approved Answer
Step: 1 Unlock

Question Has Been Solved by an Expert!
Get step-by-step solutions from verified subject matter experts
Step: 2 Unlock
Step: 3 Unlock