

Question: Consider the following survey data from 167 John Abbott students. This data reports whether or not the students attended a religious service in the last
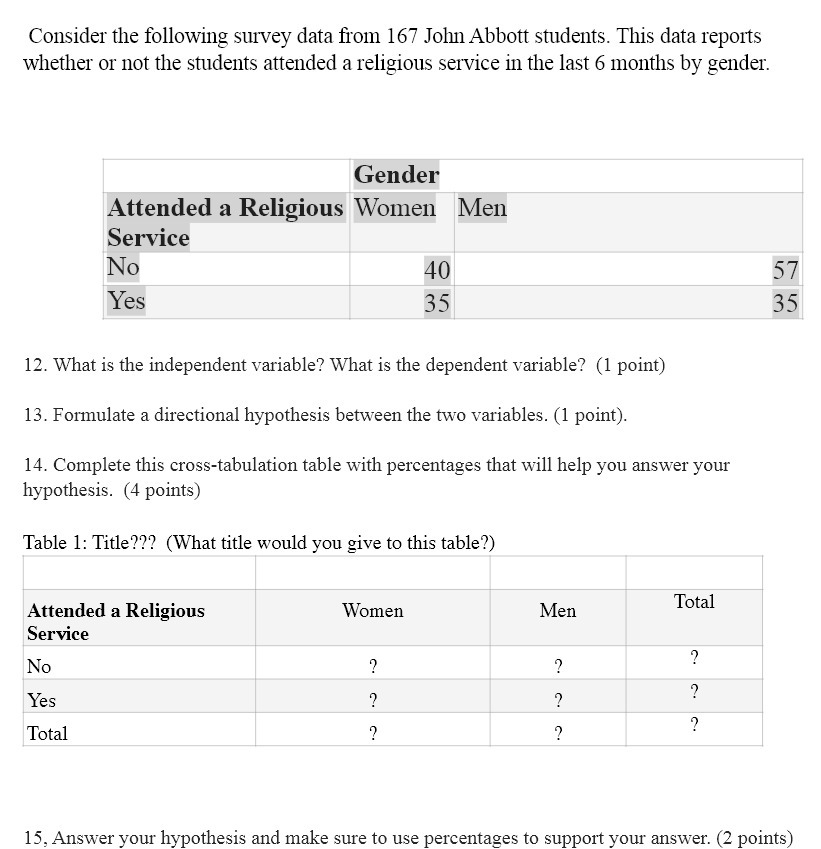

Consider the following survey data from 167 John Abbott students. This data reports whether or not the students attended a religious service in the last 6 months by gender. Gender Attended a Religious Women Men Service No 40 57 Yes 35 35 12. What is the independent variable? What is the dependent variable? (1 point) 13. Formulate a directional hypothesis between the two variables. (1 point). 14. Complete this cross-tabulation table with percentages that will help you answer your hypothesis. (4 points) Table 1: Title??? (What title would you give to this table?) Attended a Religious Women Men Total Service No Yes Total 15, Answer your hypothesis and make sure to use percentages to support your answer. (2 points)
Step by Step Solution
There are 3 Steps involved in it

Get step-by-step solutions from verified subject matter experts