

Question: Consider the following table (attached image) We know that expected returns on Market (), SMB, and HML are positive. Knowing this, should the (predicted by
Consider the following table (attached image)
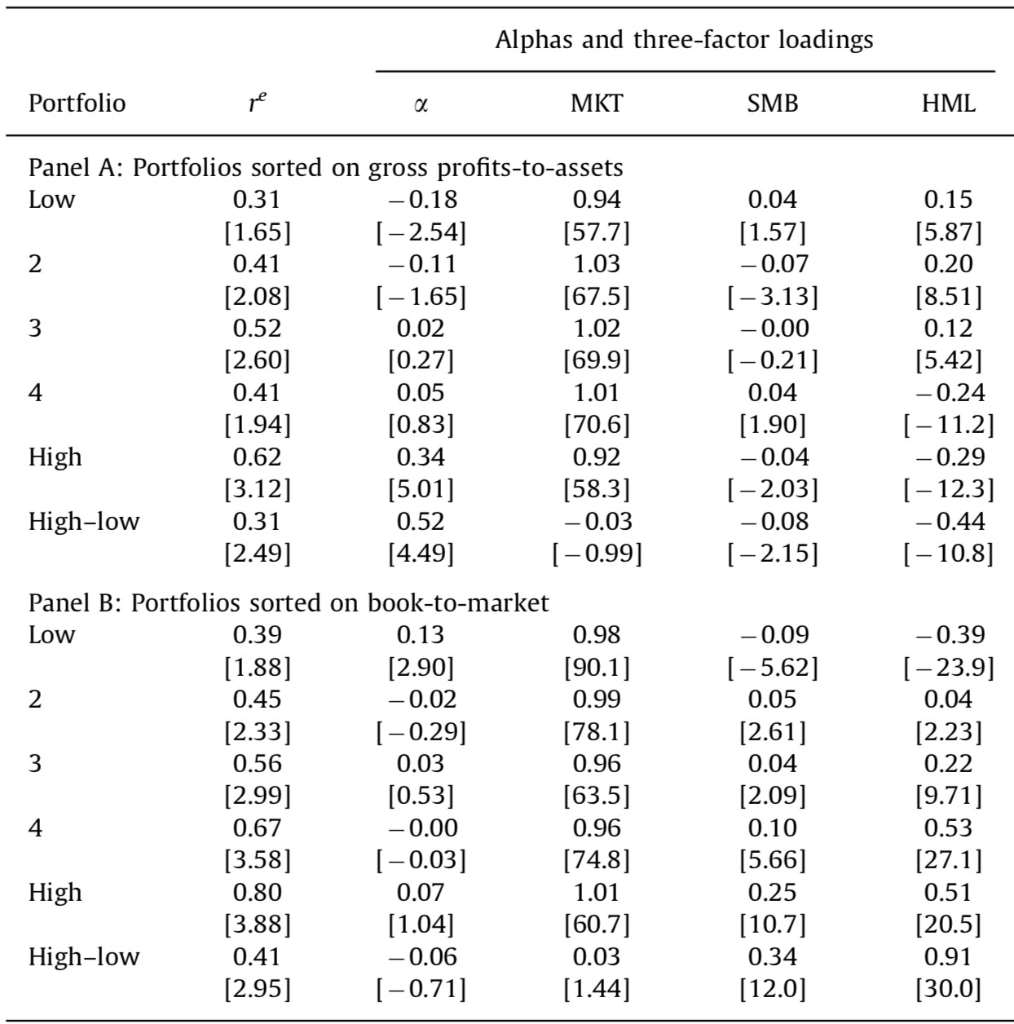
- We know that expected returns on Market (), SMB, and HML are positive. Knowing this, should the (predicted by Fama French) expected return on PROFIT trading strategy be positive or negative. (PROFIT trading strategy is High-low row in Panel A in the Table above).Should the (predicted by Fama French) expected return on VALUE trading strategy be positive or negative (VALUE trading strategy is High-low row in Panel B in the Table above).
- Consider the following trading strategy . Why is this a proper trading strategy? What would be its expected return, factor loadings and Fama French 3 factor alpha. Write your answers in the Table below.
- Strategy has non-zero loading on HML, i.e. it still has an exposure to HML risk. Consider a new trading strategy , where is chosen so as this new trading strategy has zero loading on HML. What value of you should choose? (write is in the space provided below) What would be factor loadings on other factors, Fama French alpha and expected return on this new trading strategy? Write your answers in the Table below. Make sure you provide formulas that you have used.
x=
| Strategy | Expected return | Fama French Alpha | b | s | h |
| Profit + Value | |||||
| Profit+X*value |
Alphas and three-factor loadings Portfolio MKT SMB HML Panel A: Portfolios sorted on gross profits-to-assets Low 0.31 -0.18 0.94 [1.65] [-2.54] [57.7] 0.41 -0.11 1.03 [2.08) [-1.65] [67.5) 0.52 0.02 1.02 [2.60] [0.27] [69.9] 0.41 0.05 1.01 (1.94] [0.83] [ 70.6) High 0.62 0.34 0.92 [3.12] [5.01] [58.3] High-low 0.31 0.52 -0.03 [2.49) [4.49] (-0.99] 0.04 [1.57] -0.07 [-3.13] -0.00 [-0.21] 0.04 [1.90] -0.04 [-2.03] -0.08 [-2.15] 0.15 [5.87] 0.20 [8.51] 0.12 [5.42] -0.24 [-11.2] -0.29 [-12.3] -0.44 [-10.8] Panel B: Portfolios sorted on book-to-market Low 0.39 0.13 [1.88] [2.90] 0.45 -0.02 [2.33] [-0.29] 0.56 0.03 [2.99] [0.53] 0.67 -0.00 [3.58] [-0.03] High 0.80 0.07 [3.88] High-low 0.41 -0.06 [2.95] -0.71] 0.98 [90.1] 0.99 [78.1] 0.96 [63.5] 0.96 [74.8] 1.01 [60.7] 0.03 [1.44] -0.09 [-5.62] 0.05 [2.61] 0.04 [2.09] 0.10 [5.66] 0.25 [10.7] 0.34 [12.0] -0.39 [-23.9] 0.04 [2.23] 0.22 [9.71] 0.53 [27.1] 0.51 [20.5] 0.91 [30.0] Alphas and three-factor loadings Portfolio MKT SMB HML Panel A: Portfolios sorted on gross profits-to-assets Low 0.31 -0.18 0.94 [1.65] [-2.54] [57.7] 0.41 -0.11 1.03 [2.08) [-1.65] [67.5) 0.52 0.02 1.02 [2.60] [0.27] [69.9] 0.41 0.05 1.01 (1.94] [0.83] [ 70.6) High 0.62 0.34 0.92 [3.12] [5.01] [58.3] High-low 0.31 0.52 -0.03 [2.49) [4.49] (-0.99] 0.04 [1.57] -0.07 [-3.13] -0.00 [-0.21] 0.04 [1.90] -0.04 [-2.03] -0.08 [-2.15] 0.15 [5.87] 0.20 [8.51] 0.12 [5.42] -0.24 [-11.2] -0.29 [-12.3] -0.44 [-10.8] Panel B: Portfolios sorted on book-to-market Low 0.39 0.13 [1.88] [2.90] 0.45 -0.02 [2.33] [-0.29] 0.56 0.03 [2.99] [0.53] 0.67 -0.00 [3.58] [-0.03] High 0.80 0.07 [3.88] High-low 0.41 -0.06 [2.95] -0.71] 0.98 [90.1] 0.99 [78.1] 0.96 [63.5] 0.96 [74.8] 1.01 [60.7] 0.03 [1.44] -0.09 [-5.62] 0.05 [2.61] 0.04 [2.09] 0.10 [5.66] 0.25 [10.7] 0.34 [12.0] -0.39 [-23.9] 0.04 [2.23] 0.22 [9.71] 0.53 [27.1] 0.51 [20.5] 0.91 [30.0]
Step by Step Solution
There are 3 Steps involved in it

Get step-by-step solutions from verified subject matter experts