

Question: Consider the following table for different assets for 1926 through 2017. a. What range of returns would you expect to see 68 percent of the
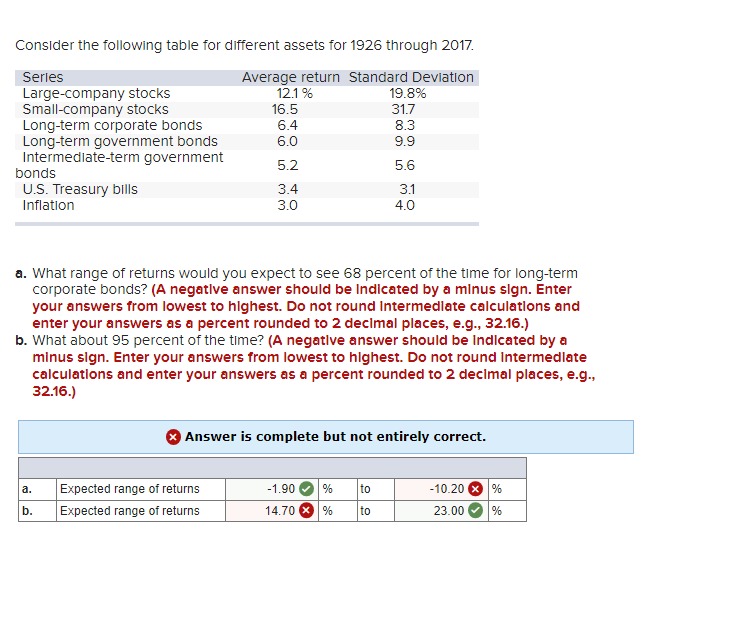
Consider the following table for different assets for 1926 through 2017. a. What range of returns would you expect to see 68 percent of the time for long-term corporate bonds? (A negative answer should be Indicated by a minus sign. Enter your answers from lowest to highest. Do not round intermedlate calculations and enter your answers as a percent rounded to 2 declmal places, e.g., 32.16.) b. What about 95 percent of the time? (A negatlve answer should be Indlcated by a minus sign. Enter your answers from lowest to highest. Do not round intermedlate calculations and enter your answers as a percent rounded to 2 decimal places, e.g., 32.16.) Consider the following table for different assets for 1926 through 2017. a. What range of returns would you expect to see 68 percent of the time for long-term corporate bonds? (A negative answer should be Indicated by a minus sign. Enter your answers from lowest to highest. Do not round intermedlate calculations and enter your answers as a percent rounded to 2 declmal places, e.g., 32.16.) b. What about 95 percent of the time? (A negatlve answer should be Indlcated by a minus sign. Enter your answers from lowest to highest. Do not round intermedlate calculations and enter your answers as a percent rounded to 2 decimal places, e.g., 32.16.)
Step by Step Solution
There are 3 Steps involved in it

Get step-by-step solutions from verified subject matter experts