

Question: Consider the following table for different assets for 1926 through 2017 Series Large-company stocks Small-company stocks Long-term corporate bonds Long-term government bonds Intermediate-term government bonds
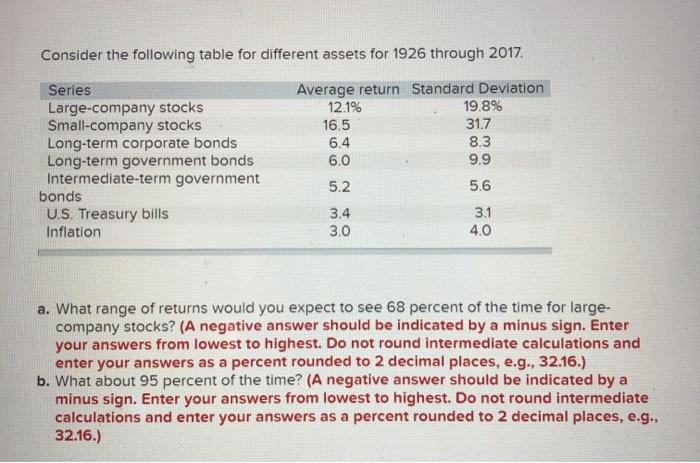
Consider the following table for different assets for 1926 through 2017 Series Large-company stocks Small-company stocks Long-term corporate bonds Long-term government bonds Intermediate-term government bonds U.S. Treasury bills Inflation Average return Standard Deviation 12.1% 19.8% 16.5 31.7 6.4 8.3 6.0 9.9 5.2 5.6 3.4 3.0 3.1 4.0 a. What range of returns would you expect to see 68 percent of the time for large- company stocks? (A negative answer should be indicated by a minus sign. Enter your answers from lowest to highest. Do not round Intermediate calculations and enter your answers as a percent rounded to 2 decimal places, e.g., 32.16.) b. What about 95 percent of the time? (A negative answer should be indicated by a minus sign. Enter your answers from lowest to highest. Do not round intermediate calculations and enter your answers as a percent rounded to 2 decimal places, e.g., 32.16.)
Step by Step Solution
There are 3 Steps involved in it

Get step-by-step solutions from verified subject matter experts