

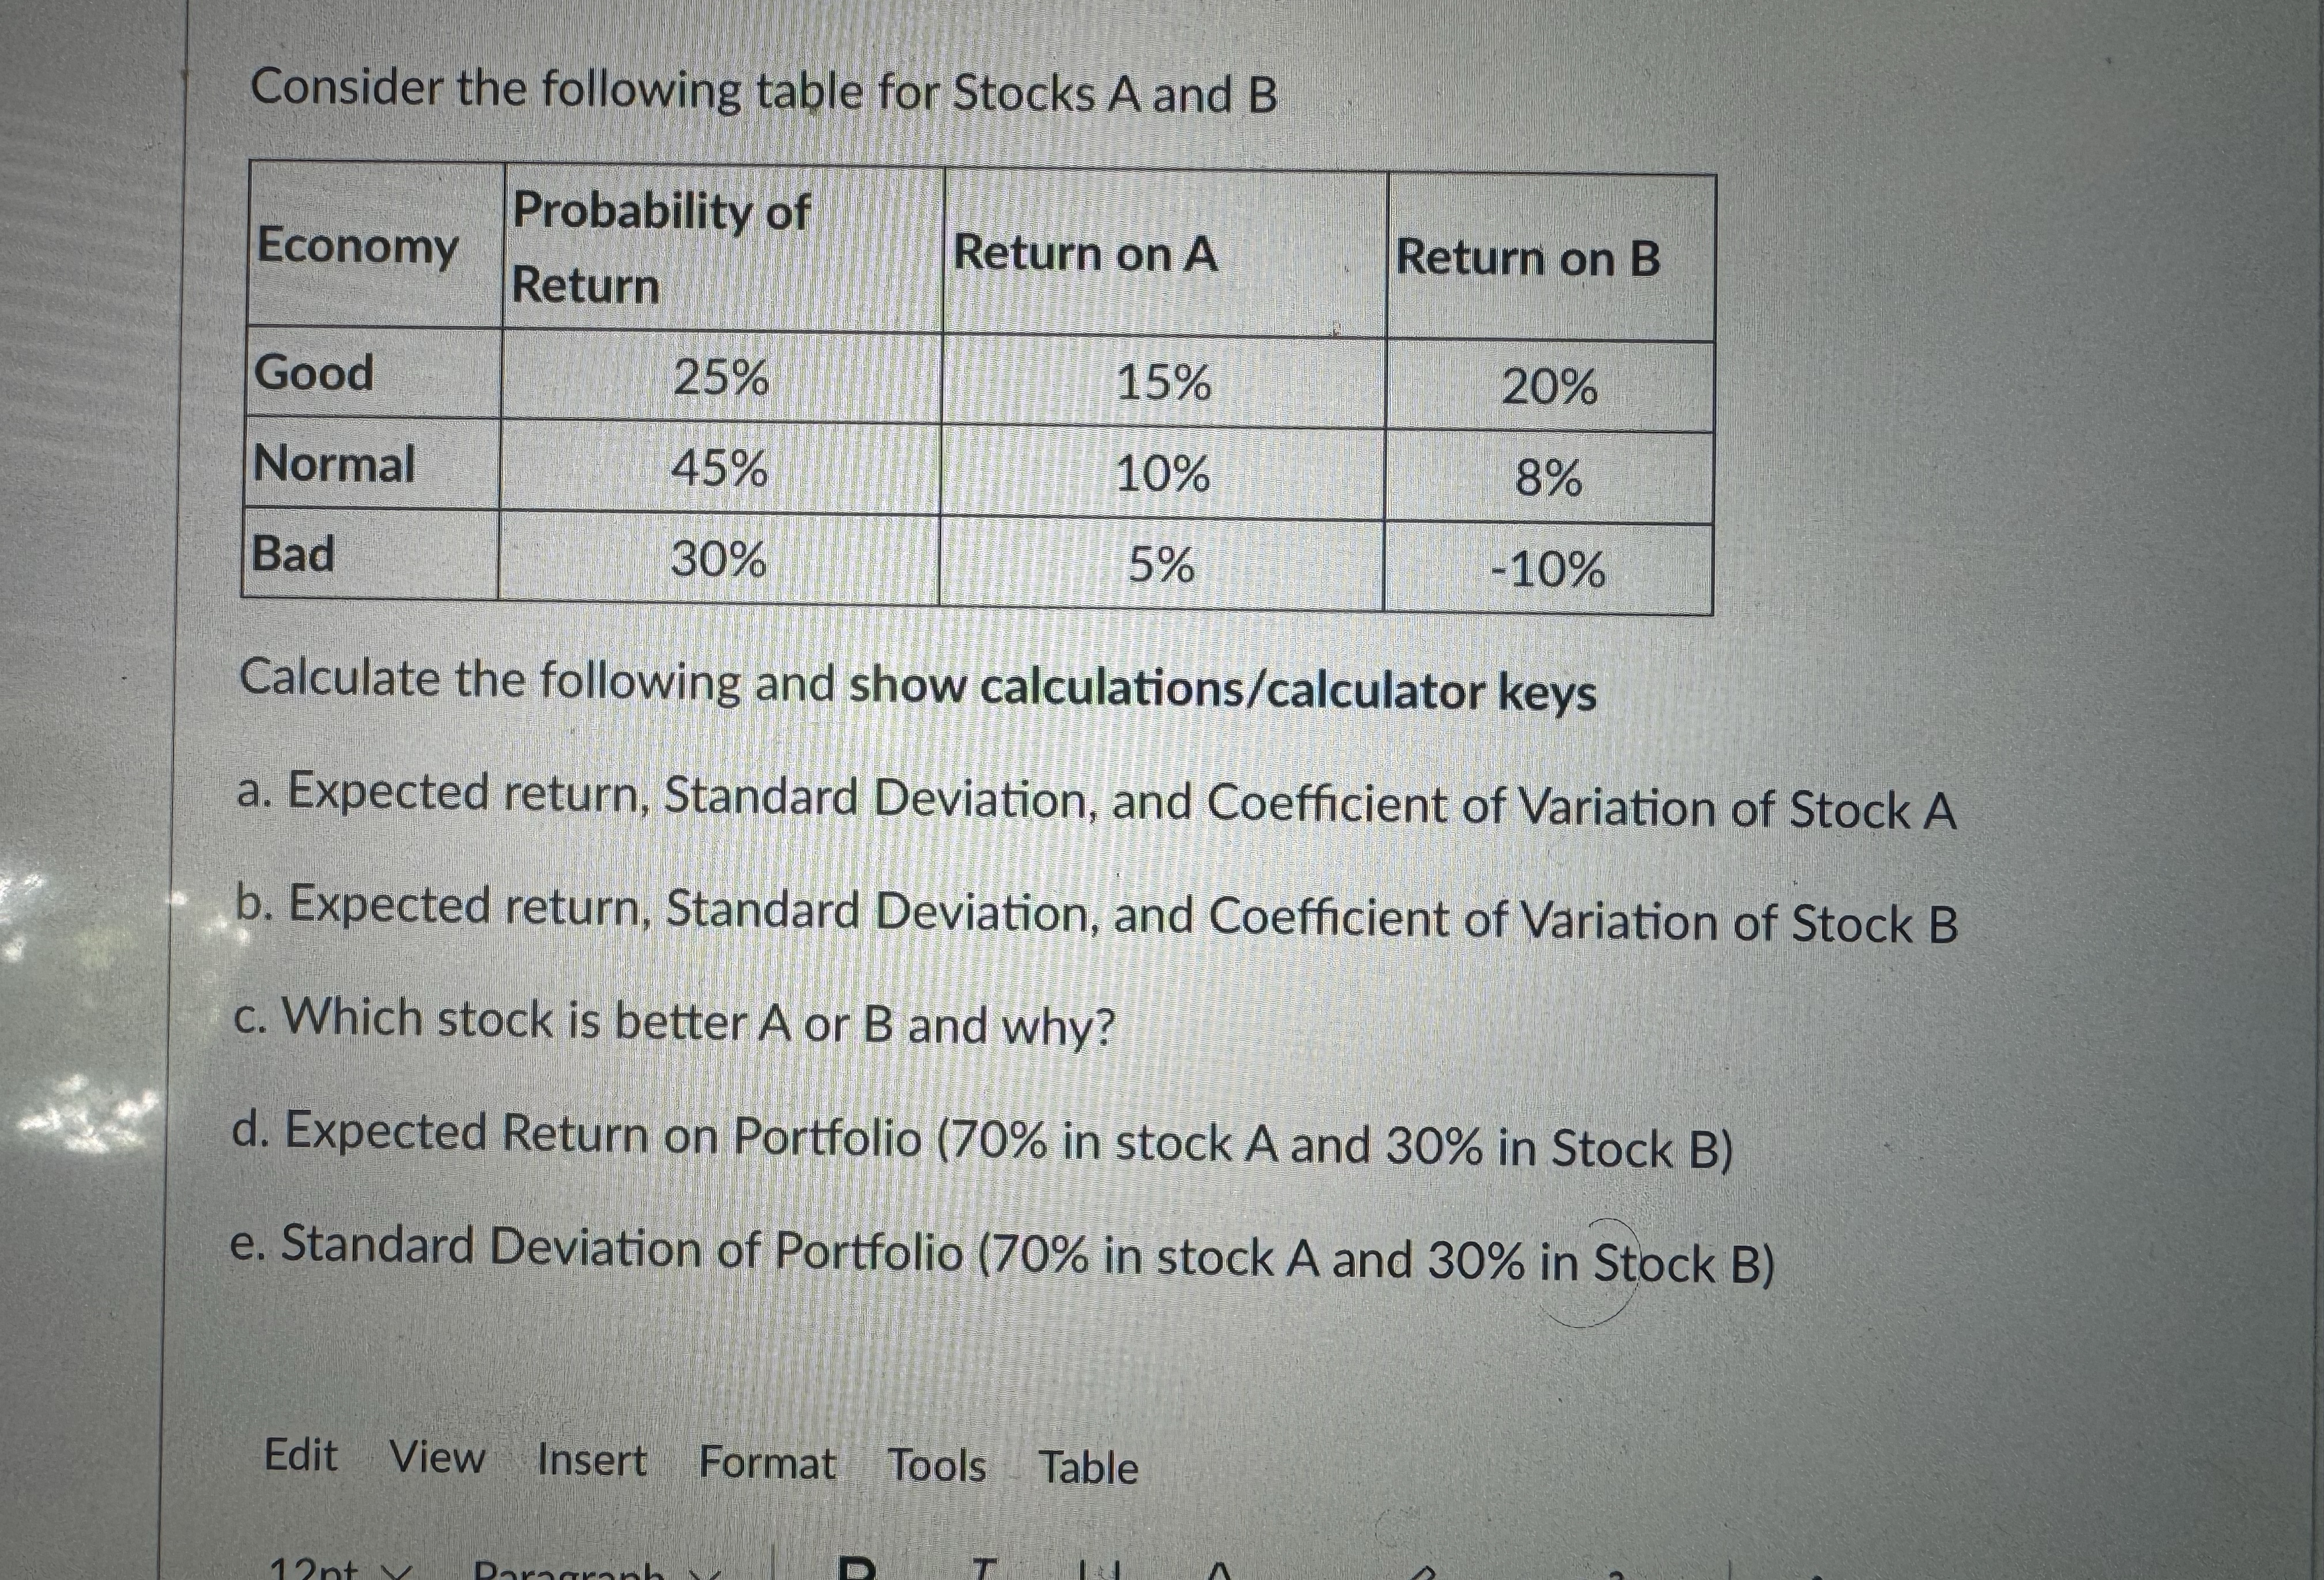
Question: Consider the following table for Stocks A and BEconomyProbability ofReturnReturn on AReturn on BGood 2 5 % 1 5 % 2 0 % Normal 4
Consider the following table for Stocks A and BEconomyProbability ofReturnReturn on AReturn on BGoodNormalBadCalculate the following and show calculationscalculator keysa. Expected return, Standard Deviation, and Coefficient of Variation of Stock Ab Expected return, Standard Deviation, and Coefficient of Variation of Stock Bc Which stock is better A or B and why?d Expected Return on Portfolio in stock A and in Stock Be Standard Deviation of Portfolio in stock A and in Stock B
Step by Step Solution
There are 3 Steps involved in it
1 Expert Approved Answer
Step: 1 Unlock

Question Has Been Solved by an Expert!
Get step-by-step solutions from verified subject matter experts
Step: 2 Unlock
Step: 3 Unlock