

Question: Consider the following table from Stats SA and answer the questions that follow: Population 16 years and above, in urban and non-urban areas, by province
Consider the following table from Stats SA and answer the questions that follow:
Population 16 years and above, in urban and non-urban areas, by province and gender (Stats Sa)
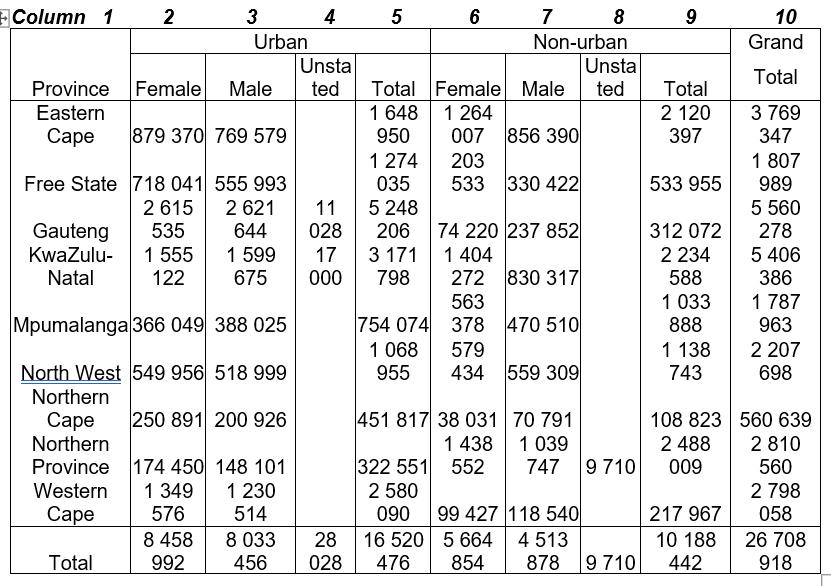
1.1 What does column 3 represent?
1.2 What does column 6 represent?
1.3 Which column represents the number of males living in non-urban areas?
1.4 If you wanted to find the total number of people, 16 years and older, living in a certain province, which column would you look in?
1.5 How many males,16 years and older, live in urban areas in KwaZulu-Natal?
1.6 What proportion is that of all the people, 16 years and older, living in KZN?
1.7 How many females, 16 years and older, live in rural areas in South Africa?
1.8 What proportion is that of all the people, 16 years and older, living in South Africa?
1.9 Which province has the smallest non-urban adult male population?
Column 1 2 3 Province Female Male Eastern Cape 879 370 769 579 Gauteng KwaZulu- Natal Urban Free State 718 041 555 993 2 615 535 2 621 644 1 555 122 Western Cape Total 1 599 675 Mpumalanga 366 049 388 025 North West 549 956 518 999 Northern 250 891 200 926 Cape Northern Province 174 450 148 101 1 349 1 230 576 514 8 458 992 8 033 456 4 Unsta ted 11 028 17 000 28 028 5 754 074 1 068 955 6 Total Female Male 1 648 1 264 950 1274 035 5 248 206 3 171 798 322 551 2 580 090 7 Non-urban Unsta ted 007 856 390 203 533 330 422 74 220 237 852 1 404 272 830 317 563 378 470 510 378 451 817 38 031 1 438 552 579 434 559 309 99 427 16 520 5 664 476 854 70 791 1 039 747 118 540 4 513 878 8 9 710 9 710 9 Total 2 120 397 533 955 312 072 2 234 588 1 033 888 1 138 743 108 823 2 488 009 217 967 10 188 442 10 Grand Total 3 769 347 1 807 989 5 560 278 5 406 386 1 787 963 2 207 698 560 639 2810 560 2 798 058 26 708 918
Step by Step Solution
3.46 Rating (159 Votes )
There are 3 Steps involved in it
11 What does column 3 represent Column 3 represents Male living in Urban areas 12 What does column 6 ... View full answer

Get step-by-step solutions from verified subject matter experts