

Question: Consider the following Table: Note that variable x= denotes promotional expenditures express in thousands of dollars and variable denotes sales per thousand of gallons of
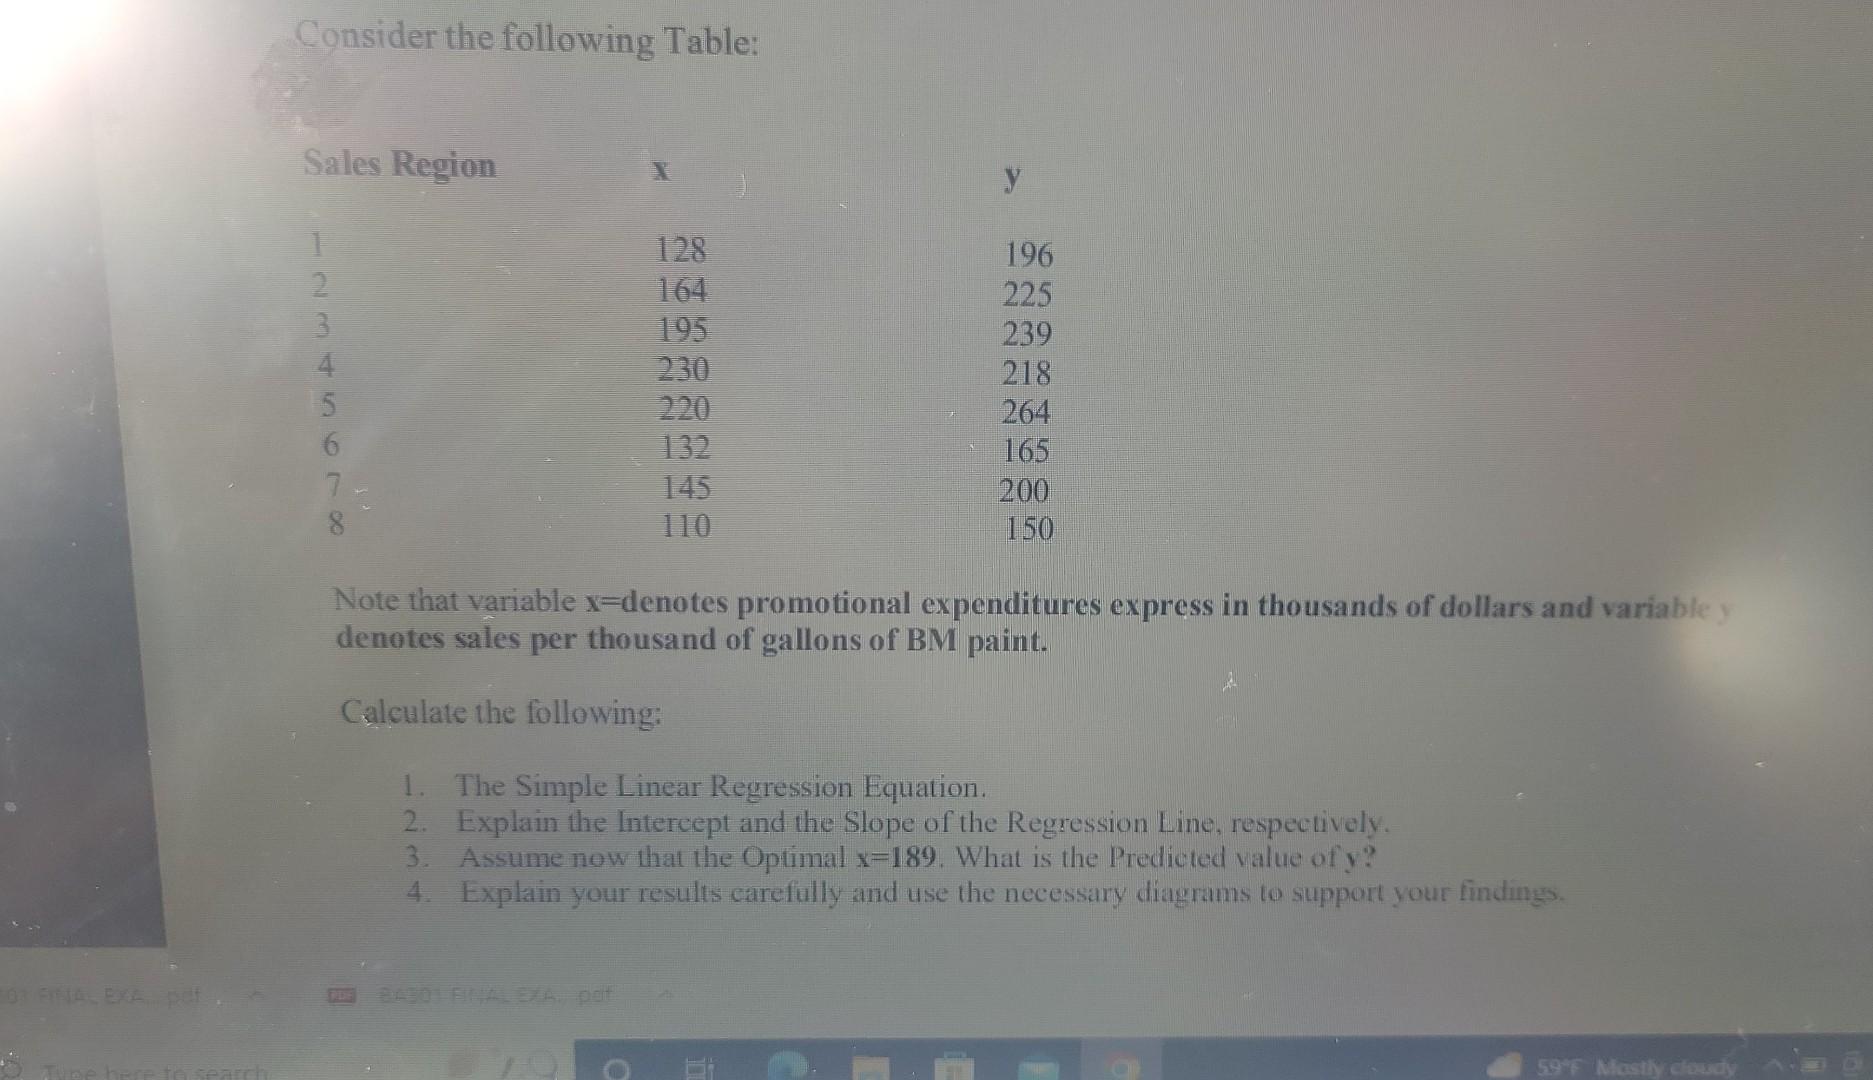
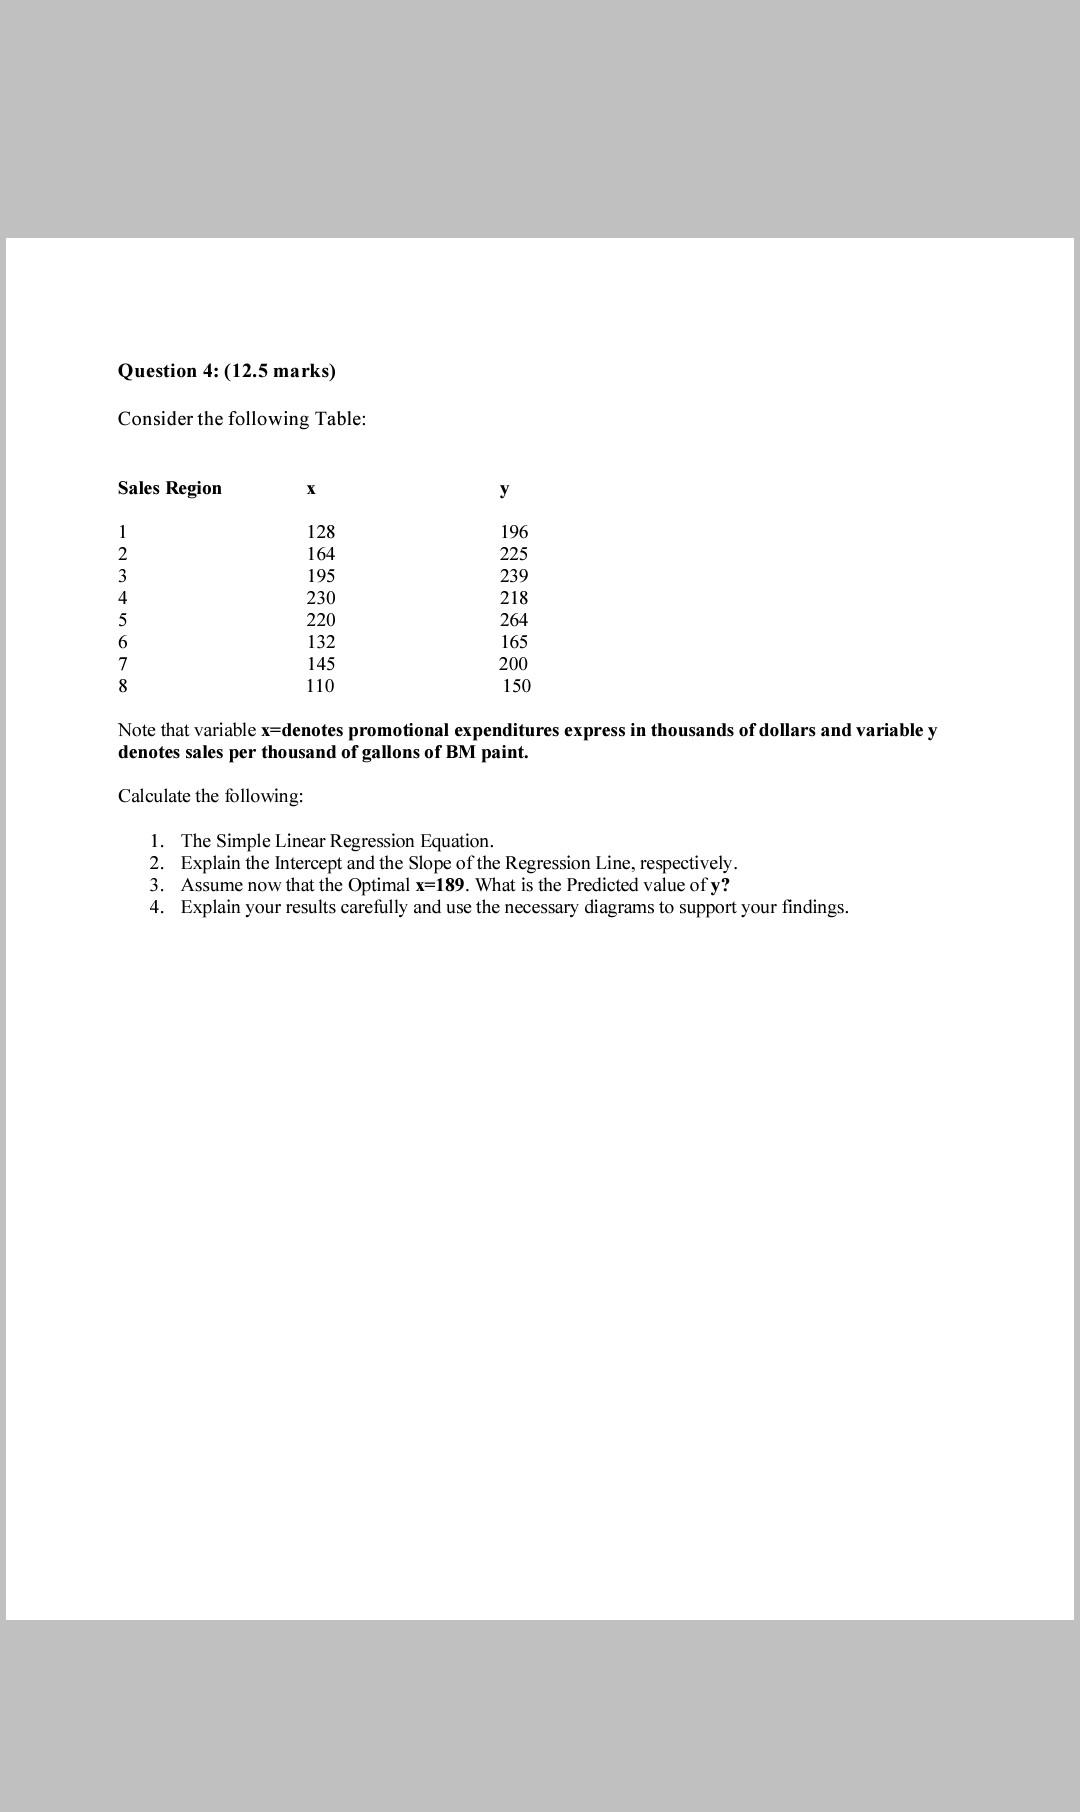
Consider the following Table: Note that variable x= denotes promotional expenditures express in thousands of dollars and variable denotes sales per thousand of gallons of BM paint. Calculate the following: 1. The Simple Linear Regression Equation. 2. Explain the Intercept and the Slope of the Regression Line, respectively. 3. Assume now that the Optimal x=189. What is the Predicted value of y ? 4. Explain your results carefully and use the necessary diagrams to support your findings. Question 4: (12.5 marks) Consider the following Table: Note that variable x= denotes promotional expenditures express in thousands of dollars and variable y denotes sales per thousand of gallons of BM paint. Calculate the following: 1. The Simple Linear Regression Equation. 2. Explain the Intercept and the Slope of the Regression Line, respectively. 3. Assume now that the Optimal x=189. What is the Predicted value of y ? 4. Explain your results carefully and use the necessary diagrams to support your findings. Consider the following Table: Note that variable x= denotes promotional expenditures express in thousands of dollars and variable denotes sales per thousand of gallons of BM paint. Calculate the following: 1. The Simple Linear Regression Equation. 2. Explain the Intercept and the Slope of the Regression Line, respectively. 3. Assume now that the Optimal x=189. What is the Predicted value of y ? 4. Explain your results carefully and use the necessary diagrams to support your findings. Question 4: (12.5 marks) Consider the following Table: Note that variable x= denotes promotional expenditures express in thousands of dollars and variable y denotes sales per thousand of gallons of BM paint. Calculate the following: 1. The Simple Linear Regression Equation. 2. Explain the Intercept and the Slope of the Regression Line, respectively. 3. Assume now that the Optimal x=189. What is the Predicted value of y ? 4. Explain your results carefully and use the necessary diagrams to support your findings
Step by Step Solution
There are 3 Steps involved in it

Get step-by-step solutions from verified subject matter experts