

Question: Consider the following table of counts, based on data from the University of California at Berkeley's graduate admissions process in 1973. School officials, who feared
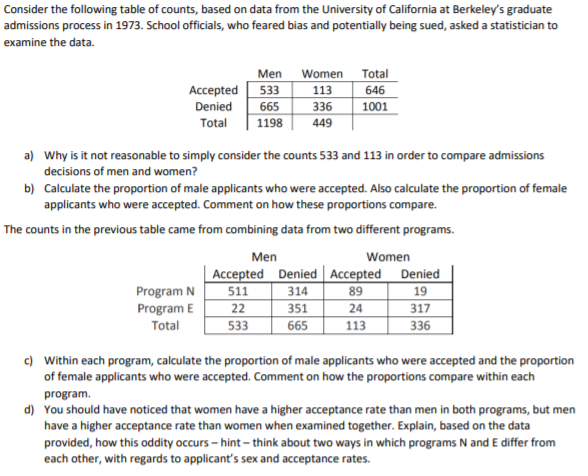
Consider the following table of counts, based on data from the University of California at Berkeley's graduate admissions process in 1973. School officials, who feared bias and potentially being sued, asked a statistician to examine the data. Men Accepted 533 Denied 665 Total 1198 Women Total 113 646 336 1001 449 a) Why is it not reasonable to simply consider the counts 533 and 113 in order to compare admissions decisions of men and women? b) Calculate the proportion of male applicants who were accepted. Also calculate the proportion of female applicants who were accepted. Comment on how these proportions compare. The counts in the previous table came from combining data from two different programs. Men Women Accepted Denied Accepted Denied Program N 511 89 19 Program E 22 351 24 317 Total 533 665 113 336 314 c) Within each program, calculate the proportion of male applicants who were accepted and the proportion of female applicants who were accepted. Comment on how the proportions compare within each program d) You should have noticed that women have a higher acceptance rate than men in both programs, but men have a higher acceptance rate than women when examined together. Explain, based on the data provided, how this oddity occurs hint-think about two ways in which programs N and E differ from each other, with regards to applicant's sex and acceptance rates
Step by Step Solution
There are 3 Steps involved in it

Get step-by-step solutions from verified subject matter experts