

Question: Consider the following table of regression output. The dependent variable is In GDP per capita. The explanatory variables are the urbanization rate in 1500
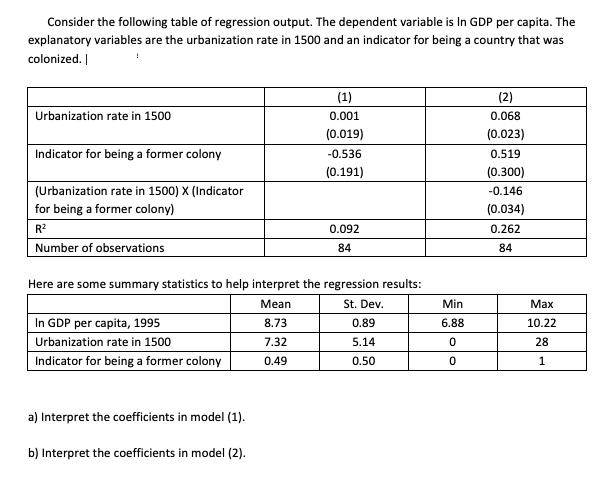
Consider the following table of regression output. The dependent variable is In GDP per capita. The explanatory variables are the urbanization rate in 1500 and an indicator for being a country that was colonized. | (1) (2) Urbanization rate in 1500 0.001 0.068 (0.019) (0.023) Indicator for being a former colony -0.536 0.519 (0.191) (0.300) (Urbanization rate in 1500) X (Indicator -0.146 for being a former colony) (0.034) R2 0.092 0.262 Number of observations 84 84 Here are some summary statistics to help interpret the regression results: Mean St. Dev. Min In GDP per capita, 1995 Urbanization rate in 1500 Indicator for being a former colony 8.73 0.89 6.88 10.22 7.32 5.14 28 0.49 0.50 1 a) Interpret the coefficients in model (1). b) Interpret the coefficients in model (2).
Step by Step Solution
3.36 Rating (162 Votes )
There are 3 Steps involved in it
can cwoitten a s From the table Here we aMadel 1 a 1 incrcase ... View full answer

Get step-by-step solutions from verified subject matter experts