

Question: Consider the following time series data. (a) Choose the correct time series plot. (i) (ii) (iv) otherwise. round intermediate calculation. y^=+QQtr+QQtr+ (c) Compute the quarterly
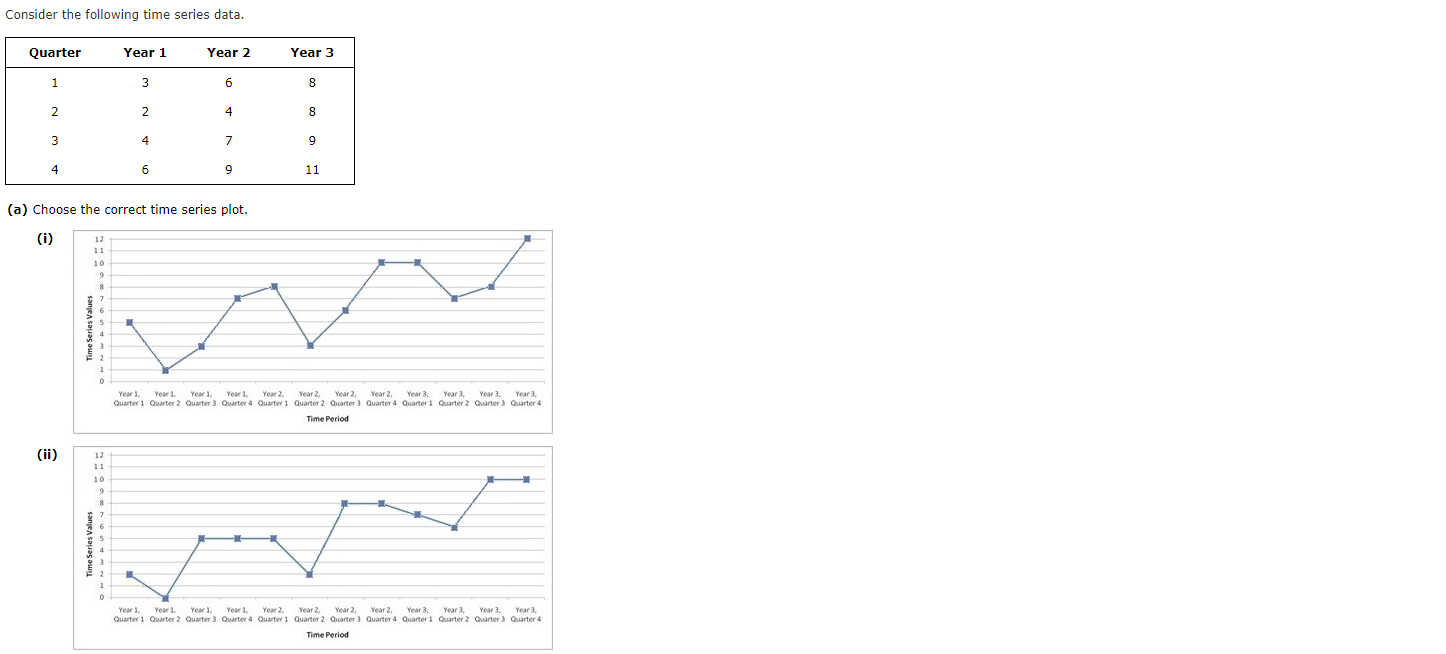
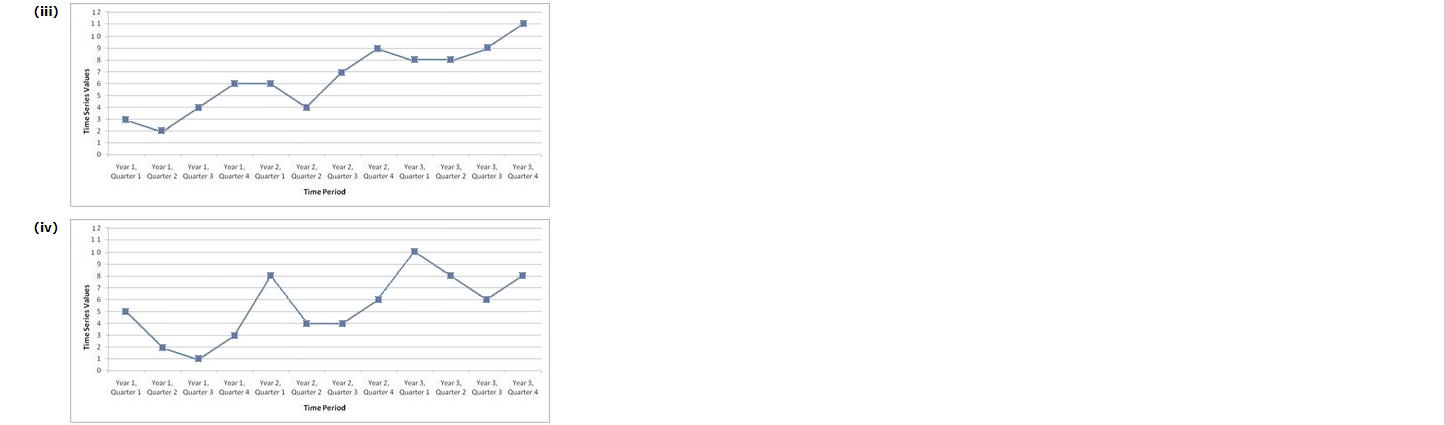
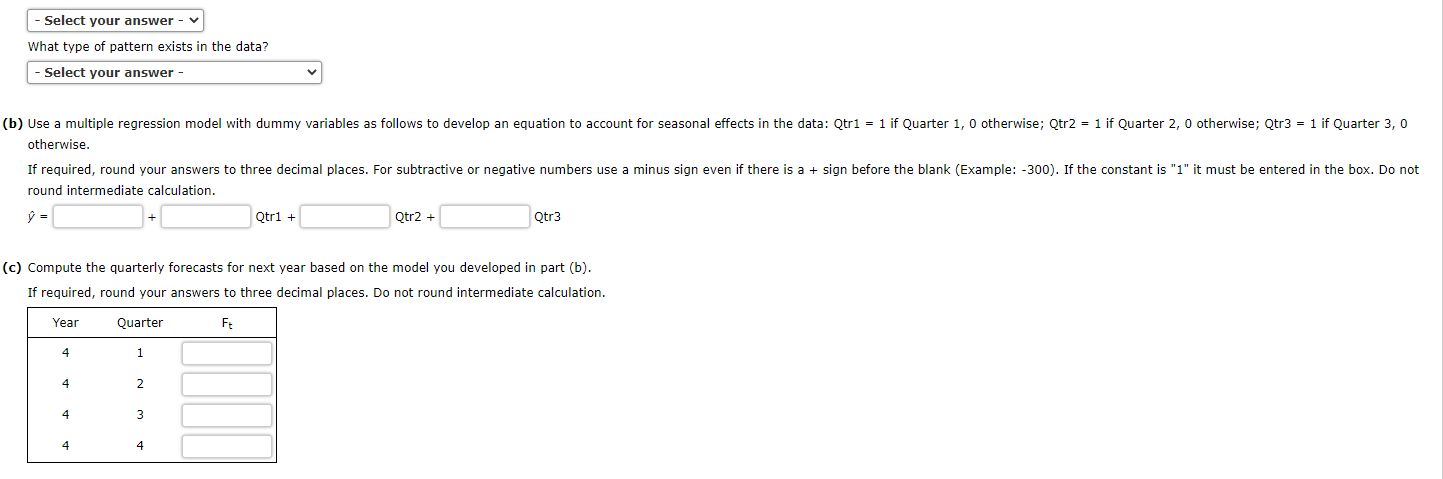
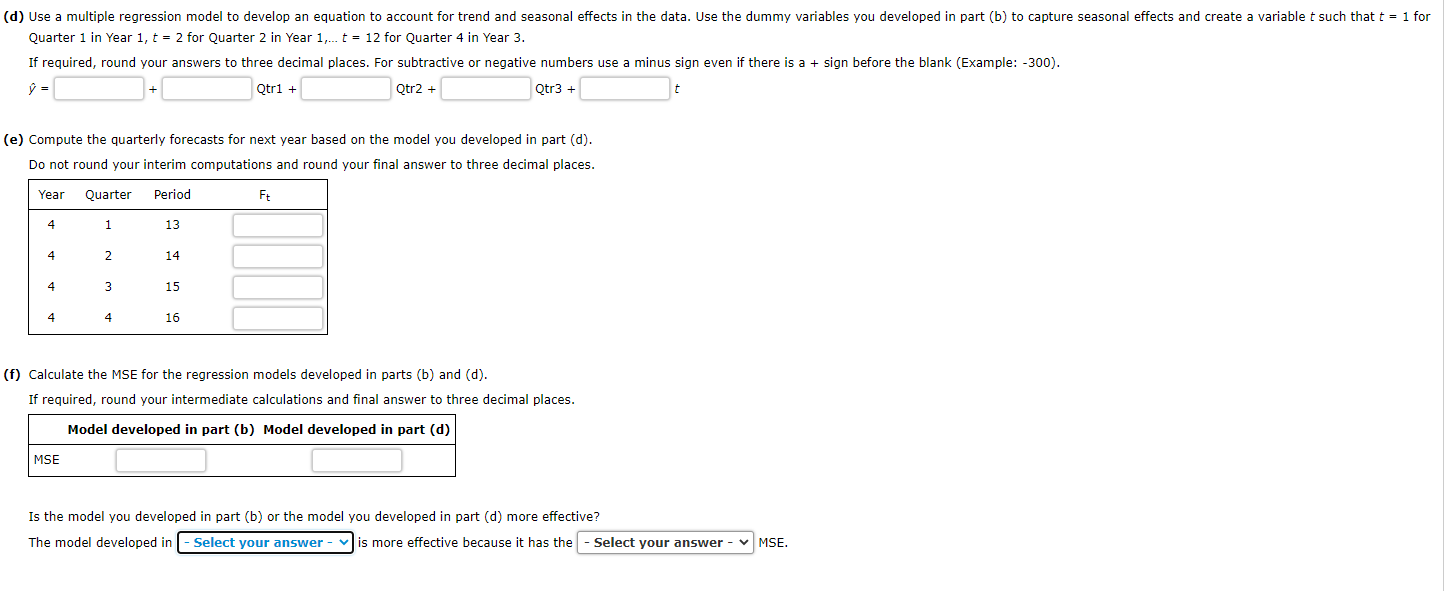
Consider the following time series data. (a) Choose the correct time series plot. (i) (ii) (iv) otherwise. round intermediate calculation. y^=+QQtr+QQtr+ (c) Compute the quarterly forecasts for next year based on the model you developed in part (b). If required, round your answers to three decimal places. Do not round intermediate calculation. Quarter 1 in Year 1,t=2 for Quarter 2 in Year 1,t=12 for Quarter 4 in Year 3. If required, round your answers to three decimal places. For subtractive or negative numbers use a minus sign even if there is a + sign before the blank (Example: 300 ). y^= Qtr1+Qtr2+Qtr3+ (e) Compute the quarterly forecasts for next year based on the model you developed in part (d). Do not round your interim computations and round your final answer to three decimal places. (f) Calculate the MSE for the regression models developed in parts (b) and (d). If required, round your intermediate calculations and final answer to three decimal places. Is the model you developed in part (b) or the model you developed in part (d) more effective? The model developed in is more effective because it has the MSE
Step by Step Solution
There are 3 Steps involved in it

Get step-by-step solutions from verified subject matter experts