

Question: Consider the following time series data. (a) Construct a time series plot. What type of pattern exists in the data? The data appear to follow
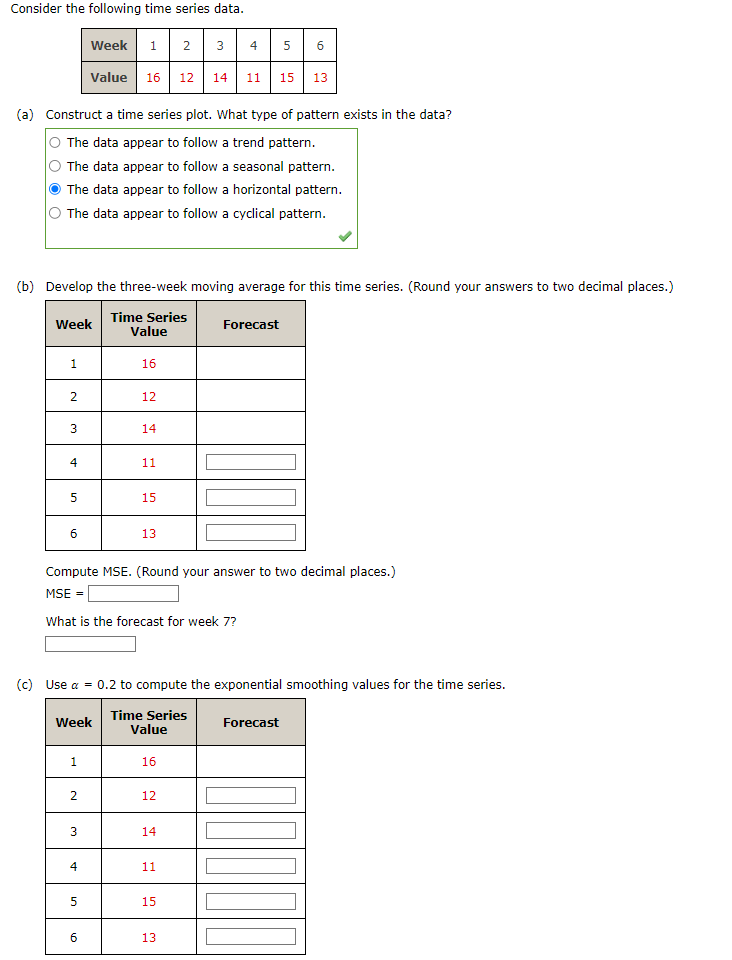
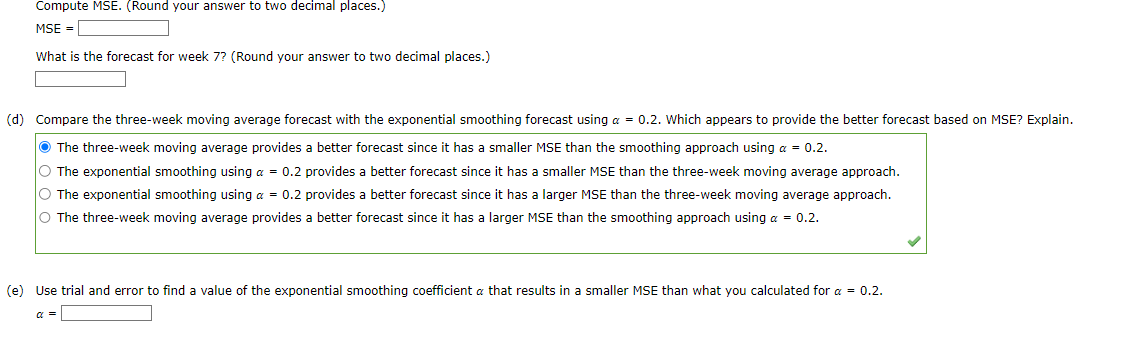
Consider the following time series data. (a) Construct a time series plot. What type of pattern exists in the data? The data appear to follow a trend pattern. The data appear to follow a seasonal pattern. The data appear to follow a horizontal pattern. The data appear to follow a cyclical pattern. (b) Develop the three-week moving average for this time series. (Round your answers to two decimal places.) Compute MSE. (Round your answer to two decimal places.) MSE= What is the forecast for week 7 ? (c) Use =0.2 to compute the exponential smoothing values for the time series. MSE = What is the forecast for week 7 ? (Round your answer to two decimal places.) (d) Compare the three-week moving average forecast with the exponential smoothing forecast using =0.2. Which appears to provide the better forecas The three-week moving average provides a better forecast since it has a smaller MSE than the smoothing approach using =0.2. The exponential smoothing using =0.2 provides a better forecast since it has a smaller MSE than the three-week moving average approach. The exponential smoothing using =0.2 provides a better forecast since it has a larger MSE than the three-week moving average approach. The three-week moving average provides a better forecast since it has a larger MSE than the smoothing approach using =0.2. (e) Use trial and error to find a value of the exponential smoothing coefficient that results in a smaller MSE than what you calculated for =0.2. =
Step by Step Solution
There are 3 Steps involved in it

Get step-by-step solutions from verified subject matter experts