

Question: Consider the following time series data. (a) Construct a time series plot. What type of pattern exists in the data? 1. The data appear to
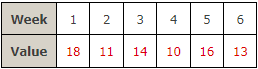
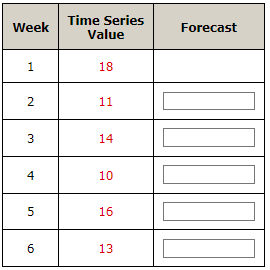
Consider the following time series data.
(a) Construct a time series plot.
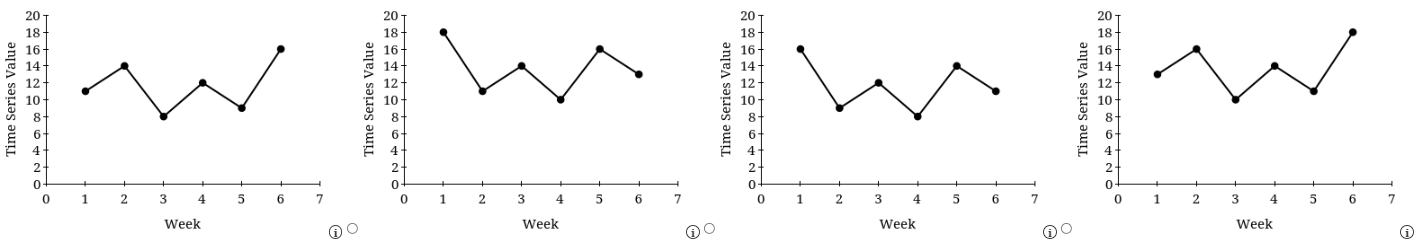
What type of pattern exists in the data?
1. The data appear to follow a horizontal pattern.
2. The data appear to follow a cyclical pattern.
3. The data appear to follow a seasonal pattern.
4. The data appear to follow a trend pattern.
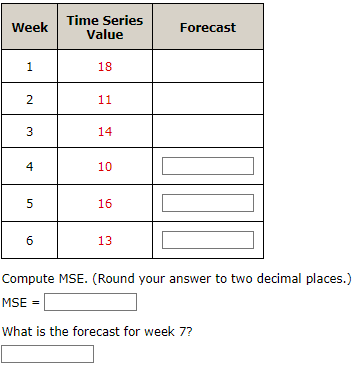
(b) Develop the three-week moving average for this time series. (Round your answers to two decimal places.)
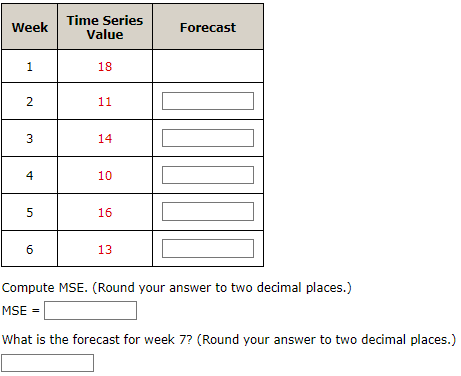
(c) Use = 0.2 to compute the exponential smoothing values for the time series.
(d) Compare the three-week moving average forecast with the exponential smoothing forecast using = 0.2. Which appears to provide the better forecast based on MSE? Explain.
1. The exponential smoothing using = 0.2 provides a better forecast since it has a smaller MSE than the three-week moving average approach.
2. The three-week moving average provides a better forecast since it has a larger MSE than the smoothing approach.
3. The three-week moving average provides a better forecast since it has a smaller MSE than the smoothing approach.
4. The exponential smoothing using = 0.2 provides a better forecast since it has a larger MSE than the three-week moving average approach.
(e) Use = 0.4 to compute the exponential smoothing values for the time series.
Does a smoothing constant of 0.2 or 0.4 appear to provide more accurate forecasts based on MSE? Explain.
1. The exponential smoothing using = 0.2 provides a better forecast since it has a larger MSE than the exponential smoothing using = 0.4.
2. The exponential smoothing using = 0.2 provides a better forecast since it has a smaller MSE than the exponential smoothing using = 0.4.
3. The exponential smoothing using = 0.4 provides a better forecast since it has a smaller MSE than the exponential smoothing using = 0.2.
4. The exponential smoothing using = 0.4 provides a better forecast since it has a larger MSE than the exponential smoothing using = 0.2.
Week 1 2 3 4 5 6 Value 18 11 14 10 16 13 Time Series Value 00 ONO Time Series Value N Week o Time Series Value ON 00 ON 008 N Week Time Series Value OOO O 008 N Week Week Time Series Value Forecast 1 1 18 2 11 3 14 4 10 5 16 6 13 Compute MSE. (Round your answer to two decimal places.) MSE = What is the forecast for week 7? Week Time Series Value Forecast 1 1 18 2 11 3 14 4 10 5 16 6 13 Compute MSE. (Round your answer to two decimal places.) MSE - What is the forecast for week 7? (Round your answer to two decimal places.) Week Time Series Value Forecast 1 18 2 11 3 14 4 10 5 16 6 13
Step by Step Solution
There are 3 Steps involved in it

Get step-by-step solutions from verified subject matter experts