

Question: Consider the following time series data. Quarter 1 2 3 4 (ii) (a) Choose the correct time series plot. (i) 10 9 A 7
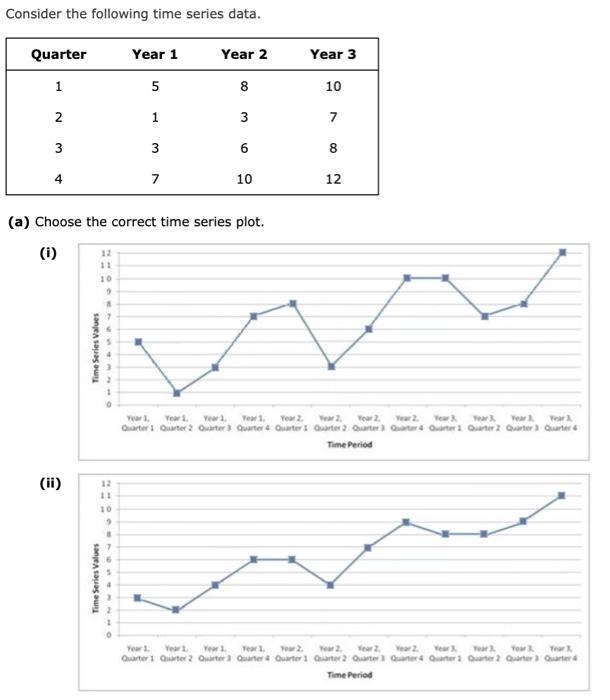
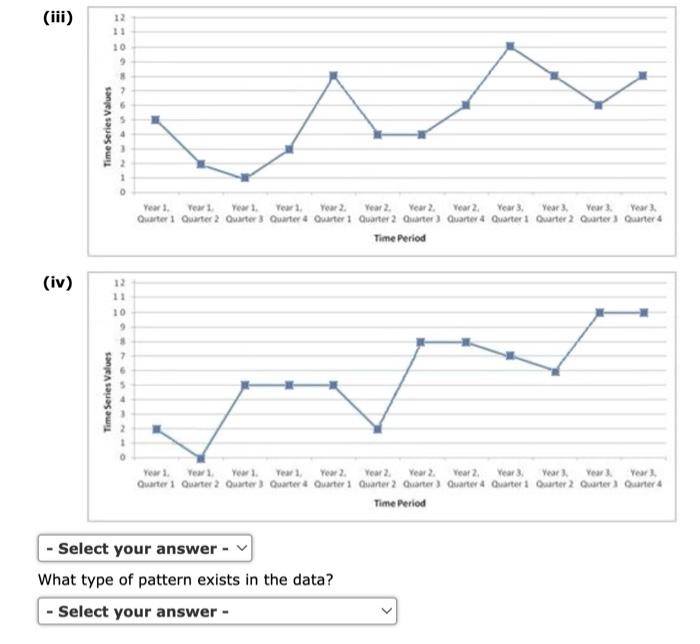
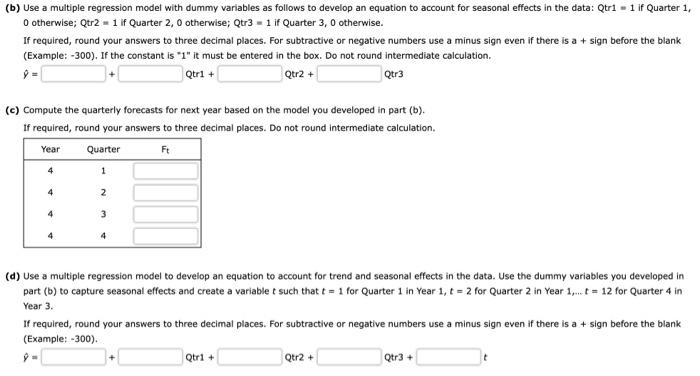
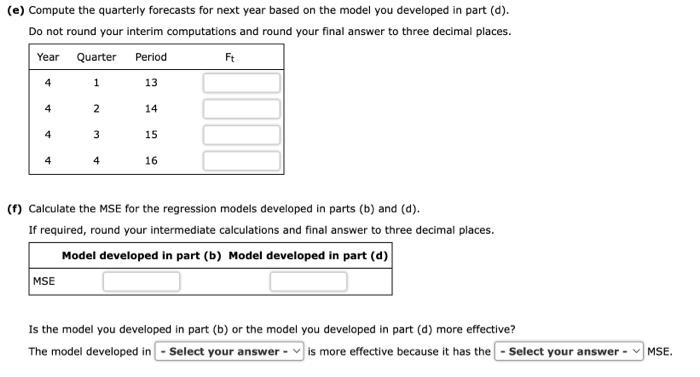
Consider the following time series data. Quarter 1 2 3 4 (ii) (a) Choose the correct time series plot. (i) 10 9 A 7 6 Time Series Values 12 Time Series Values VYMANO 12 11 10 9 8 7 6 Year 1 5 1 5432 3 7 Year 2 8 3 6 10 Year 1, Year 1. Year 1, Year 1. Quarter Quarter 2 Quarter 3 Quarter 4 Year 1 Year 1. Quarter 1 Quarter 2 Year 2 Quarter 1 Year 3 10 7 8 12 Year 2 Quarter 2 Quarter) Time Period Year 2. Year 3 Year 3 Year 3 Year Quarter 4 Quarter 1 Quarter 2 Quarter 3 Quarter 4 Year 1 Year 2 Year 2 Year 2 Year 2 Year 3, Year 3 Your 1 Year 3 Quarter 3 Quarter 4 Quarter 1 Quarter 2 Quarter 3 Quarter 4 Quarter1 Quarter 2 Quarter 3 Quarter4 Time Period (iii) 12 11 10 9 (iv) Time Series Values Time Series Values 8 7 4 1 0 12 11 10 9 8 7 6 5 4 3 1 0 Year 1. Quarter 1 Year 1 Year 1. Quarter 2 Quarter 3 Year 1. Year 2 Quarter 4 Quarter 1 Year 2. Year 2 Year 2, Year 3, Quarter 2 Quarter 3 Quarter 4 Quarter 1 Time Period - Select your answer - What type of pattern exists in the data? Select your answer - Year 3, Year 3. Quarter 2 Quarter 3 Year 3, Quarter 4 Year 2 Year 2 Year 3, Year 2 Year 3 Year 3. Year 3 Year 1, Year 1 Year 2 Quarter 1 Quarter 2 Quarter 3 Quarter 4 Quarter 1 Quarter 2 Quarter 3 Quarter 4 Quarter 1 Quarter 2 Quarter 3 Quarter 4 Time Period (b) Use a multiple regression model with dummy variables as follows to develop an equation to account for seasonal effects in the data: Qtr1= 1 if Quarter 1, 0 otherwise; Qtr2 = 1 if Quarter 2, 0 otherwise; Qtr3= 1 if Quarter 3, 0 otherwise. If required, round your answers to three decimal places. For subtractive or negative numbers use a minus sign even if there is a + sign before the blank (Example: -300). If the constant is "1" it must be entered in the box. Do not round intermediate calculation. Qtr1 + Qtr2+ Qtr3 (c) Compute the quarterly forecasts for next year based on the model you developed in part (b). If required, round your answers to three decimal places. Do not round intermediate calculation. Ft Year Quarter 4 4 4 1 2 3 (d) Use a multiple regression model to develop an equation to account for trend and seasonal effects in the data. Use the dummy variables you developed in part (b) to capture seasonal effects and create a variable t such that t = 1 for Quarter 1 in Year 1, t = 2 for Quarter 2 in Year 1,... t= 12 for Quarter 4 in Year 3. If required, round your answers to three decimal places. For subtractive or negative numbers use a minus sign even if there is a + sign before the blank (Example: -300). Qtri + Qtr2 + Qtr3+ (e) Compute the quarterly forecasts for next year based on the model you developed in part (d). Do not round your interim computations and round your final answer to three decimal places. Year Period 13 4 4 4 4 Quarter 1 MSE 2 3 4 14 15 16 Ft (f) Calculate the MSE for the regression models developed in parts (b) and (d). If required, round your intermediate calculations and final answer to three decimal places. Model developed in part (b) Model developed in part (d) Is the model you developed in part (b) or the model you developed in part (d) more effective? The model developed in - Select your answer is more effective because it has the - Select your answer - MSE.
Step by Step Solution
3.45 Rating (145 Votes )
There are 3 Steps involved in it
a To analyze the correct time series plot for the data presented lets consider the dataset and examine each of the options provided Time Series Data Q... View full answer

Get step-by-step solutions from verified subject matter experts