

Question: Consider the following time series data. Quarter | Year1 | Year2 | Year3 1 3 5 6 2 1 2 5 3 2 4 5
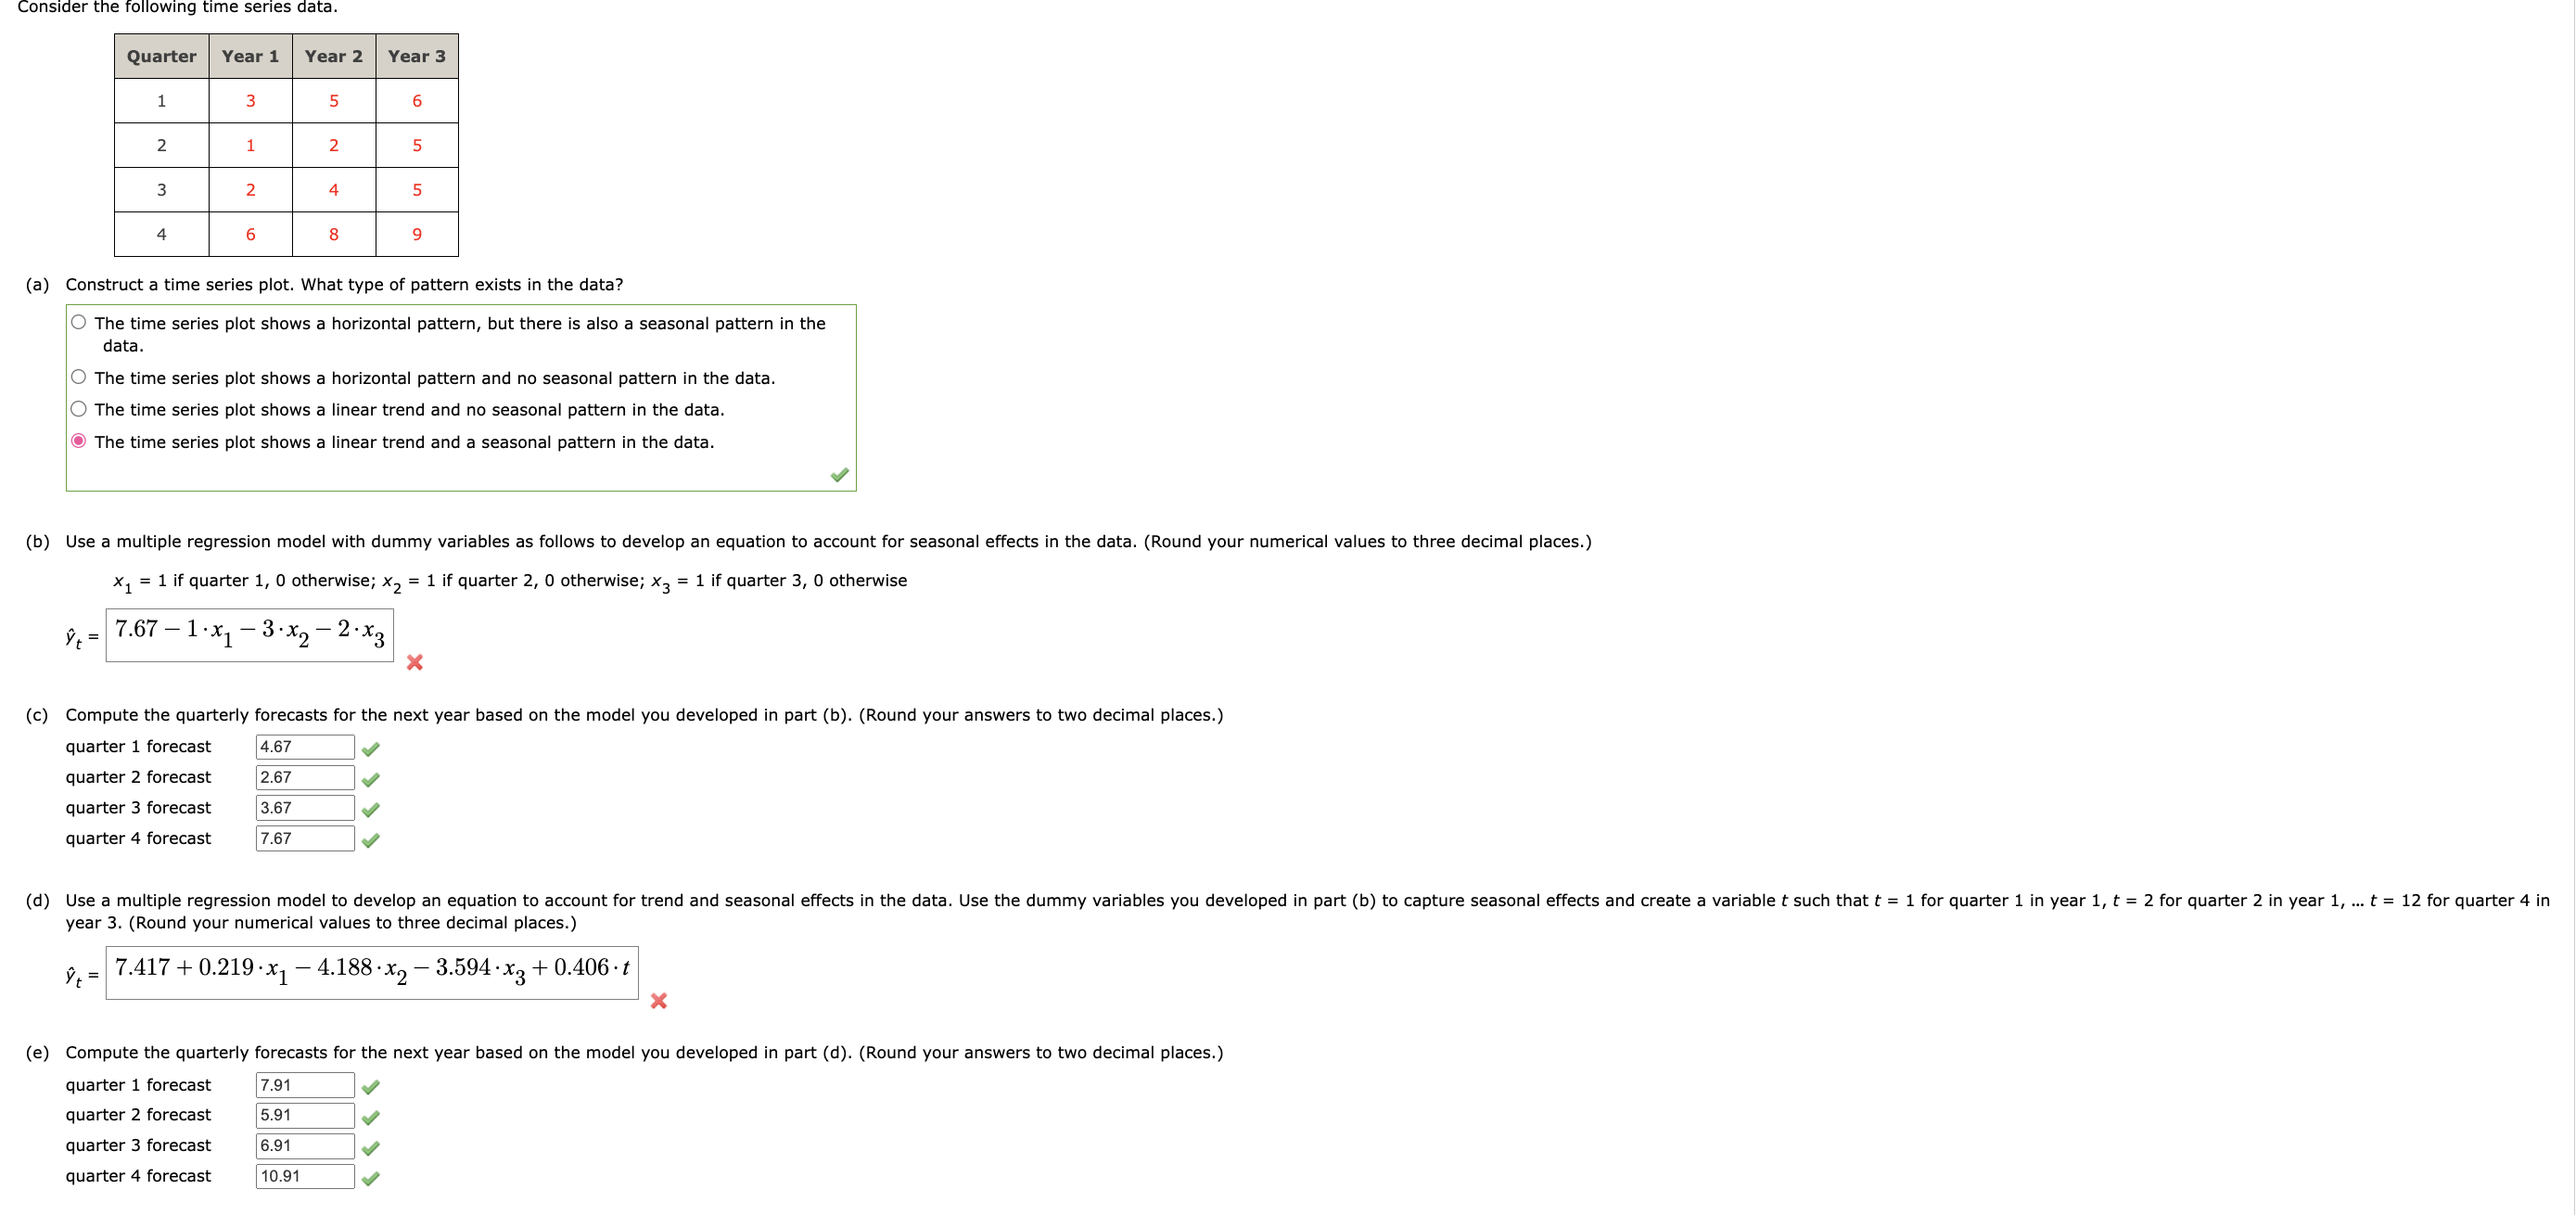
Consider the following time series data. Quarter | Year1 | Year2 | Year3 1 3 5 6 2 1 2 5 3 2 4 5 4 6 8 9 (a) Construct a time series plot. What type of pattern exists in the data? O The time series plot shows a horizontal pattern, but there is also a seasonal pattern in the data. O The time series plot shows a horizontal pattern and no seasonal pattern in the data. O The time series plot shows a linear trend and no seasonal pattern in the data. @ The time series plot shows a linear trend and a seasonal pattern in the data. (b) Use a multiple regression model with dummy variables as follows to develop an equation to account for seasonal effects in the data. (Round your numerical values to three decimal places.) % 1 = 1if quarter 1, 0 otherwise; x, = 1 if quarter 2, 0 otherwise; x5 = 1 if quarter 3, 0 otherwise o= 7.67711173):272):3 x (c) Compute the quarterly forecasts for the next year based on the model you developed in part (b). (Round your answers to two decimal places.) quarter 1 forecast [4.67 v quarter 2 forecast 267 v quarter 3 forecast (3,67 v quarter 4 forecast 7.67 v (d) Use a multiple regression model to develop an equation to account for trend and seasonal effects in the data. Use the dummy variables you developed in part (b) to capture seasonal effects and create a variable such that = 1 for quarter 1 in year 1, t = 2 for quarter 2 in year 1, ... t year 3. (Round your numerical values to three decimal places.) 2 for quarter 4 in 7.417+0.219 (e) Compute the quarterly forecasts for the next year based on the model you developed in part (d). (Round your answers to two decimal places.) quarter 1 forecast [7.91 v quarter 2 forecast 591 v quarter 3 forecast v quarter 4 forecast v
Step by Step Solution
There are 3 Steps involved in it

Get step-by-step solutions from verified subject matter experts