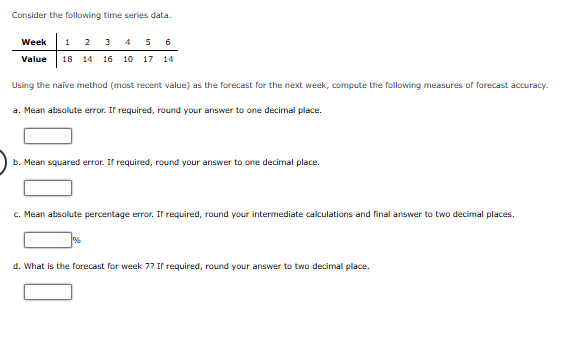
Question: Consider the following time series data. Week 1 2 3 4 5 6 Value 18 14 16 10 17 14 Using the naive method (most

Consider the following time series data. Week 1 2Consider the following time series data. Week 1 2Consider the following time series data. Week 1 2
Consider the following time series data. Week 1 2 3 4 5 6 Value 18 14 16 10 17 14 Using the naive method (most recent value) as the forecast for the next week, compute the following measures of forecast accuracy. a. Mean absolute error. If required, round your answer to one decimal place. b. Mean squared error. If required, round your answer to one decimal place. C. Mean absolute percentage error. If required, round your intermediate calculations and final answer to two decimal places. d. What is the forecast for week 7? If required, round your answer to two decimal place.With the gasoline time series data from the given table, show the exponential smoothing forecasts using a = 0.1. GASOLINE SALES TIME SERIES Week Sales (1000s of gallons) 17 21 19 23 18 16 20 18 22 20 22 a. Applying the MSE measure of forecast accuracy, would you prefer a smoothing constant of a = 0.1 or a = 0.2 for the gasoline sales time series? Do not round your interim computations and round your final answers to three decimal places. 0 =0.1 0 = 0.2 Prefer: b. Are the results the same if you apply MAE as the measure of accuracy? Do not round your interim computations and round your final answers to three decimal places. 0 = 0.1 0 = 0.2 MAE Prefer: c. What are the results if MAPE is used? Do not round your interim computations and round your final answers to two decimal places. 0 =0.1 0 = 0.2 MAPE %Prefer

Step by Step Solution

There are 3 Steps involved in it

1 Expert Approved Answer
Step: 1 Unlock blur-text-image
Question Has Been Solved by an Expert!

Get step-by-step solutions from verified subject matter experts

Step: 2 Unlock
Step: 3 Unlock

Students Have Also Explored These Related Mathematics Questions!