

Question: Consider the following two charts, representing the same data and two different regression lines, without indicating the value of R: New cases 30 25
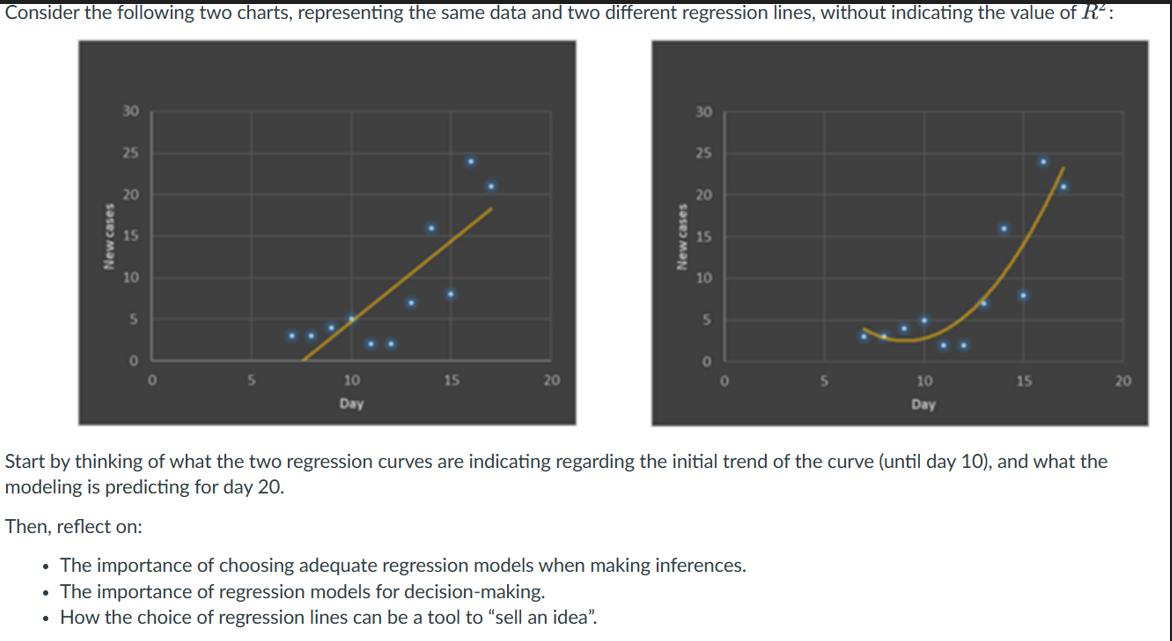
Consider the following two charts, representing the same data and two different regression lines, without indicating the value of R: New cases 30 25 20 15 10 5 0 10 Day 15 20 New cases 30 25 20 15 10 5 0 5 10 Day 15 Start by thinking of what the two regression curves are indicating regarding the initial trend of the curve (until day 10), and what the modeling is predicting for day 20. Then, reflect on: The importance of choosing adequate regression models when making inferences. The importance of regression models for decision-making. How the choice of regression lines can be a tool to "sell an idea". 20
Step by Step Solution
There are 3 Steps involved in it
Start by thinking of what the two regression curves are indicating regarding the initial trend of th... View full answer

Get step-by-step solutions from verified subject matter experts