

Question: Consider the following X-bar control chart. Apply the eight sensitizing rules for this chart and select below each of the rules that apply. 5 UCL=4.550
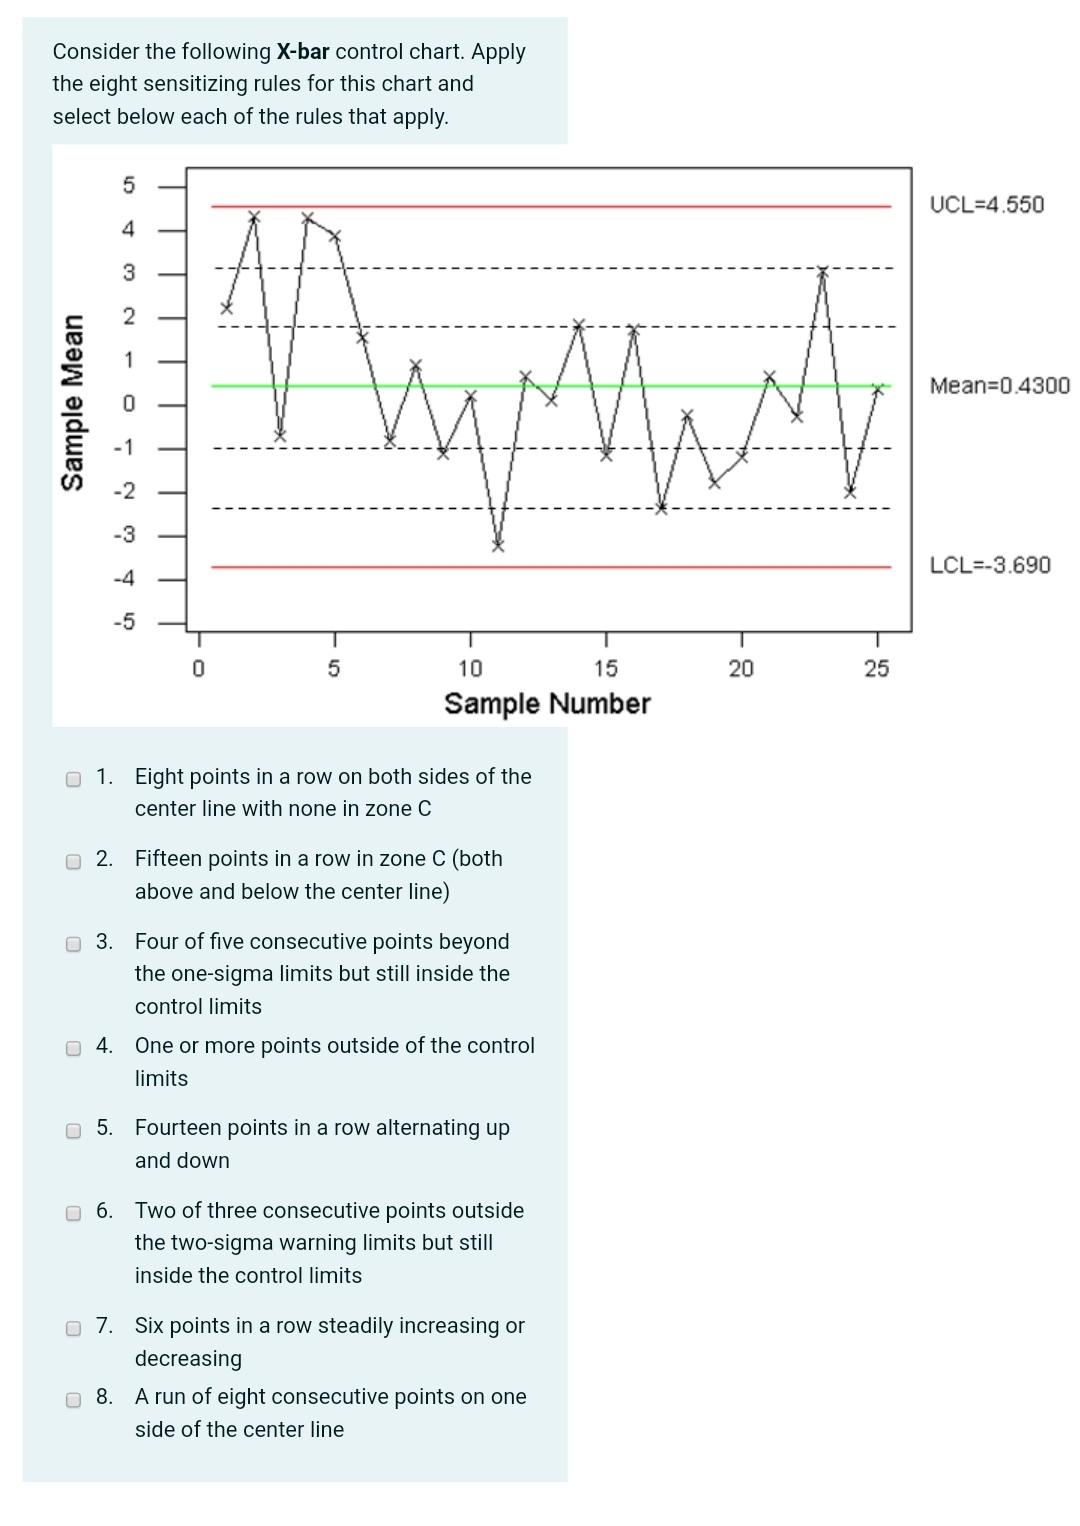
Consider the following X-bar control chart. Apply the eight sensitizing rules for this chart and select below each of the rules that apply. 5 UCL=4.550 4 3 2 When Sample Mean . Mean=0.4300 -2 -3 LCL=-3.690 -4 o 0 5 20 25 10 15 Sample Number 1. Eight points in a row on both sides of the center line with none in zone C 2. Fifteen points in a row in zone C (both above and below the center line) 3. Four of five consecutive points beyond the one-sigma limits but still inside the control limits 4. One or more points outside of the control limits 5. Fourteen points in a row alternating up and down 6. Two of three consecutive points outside the two-sigma warning limits but still inside the control limits 7. Six points in a row steadily increasing or decreasing 08. A run of eight consecutive points on one side of the center line
Step by Step Solution
There are 3 Steps involved in it
1 Expert Approved Answer
Step: 1 Unlock

Question Has Been Solved by an Expert!
Get step-by-step solutions from verified subject matter experts
Step: 2 Unlock
Step: 3 Unlock