

Question: Consider the frequency distribution shown to the right for a sample of Class 40 observations. Frequency 0-4 5 5-9 6 a. Calculate the sample mean.
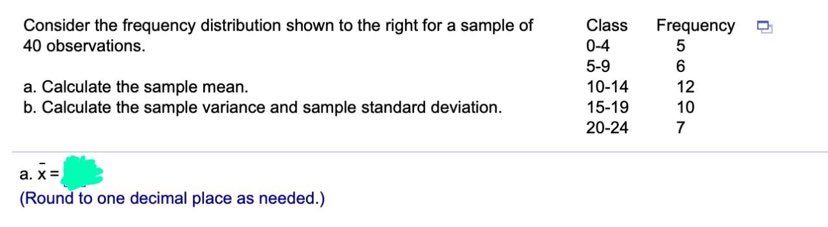
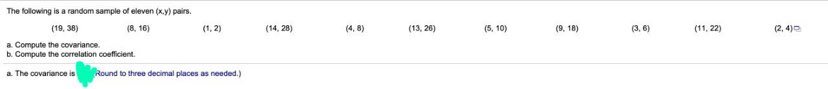
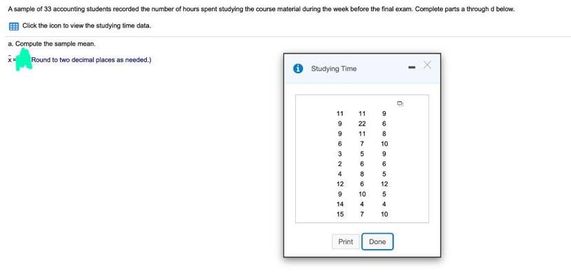
Consider the frequency distribution shown to the right for a sample of Class 40 observations. Frequency 0-4 5 5-9 6 a. Calculate the sample mean. 10-14 12 b. Calculate the sample variance and sample standard deviation. 15-19 10 20-24 7 a. X = (Round to one decimal place as needed.)The following is a random sample of eleven (x.y) pairs. (19, 38) (8. 16] (1, 2) (14. 28) (4, 8) (13, 20] (5. 10) (9. 18) (11. 22) (2, 4)0 A. Compute the covariance b. Compute the correlation coefficient. a. The covariance is Round to three decimal places as needed.)A rumple of 39 accounting students recorded the number of hours spent studying the course material during the week before the final exam. Complete parts . Urough d below Cock the kon to view the studying time data. a. Compute the sample mean Round to two decimal places as needed ) Studying Time - X 27 10 14 Print Dang
Step by Step Solution
There are 3 Steps involved in it

Get step-by-step solutions from verified subject matter experts