

Question: Consider the function f(x) = ax2 + bx + c. The graph of y = f(x) is shown in the diagram. The vertex of
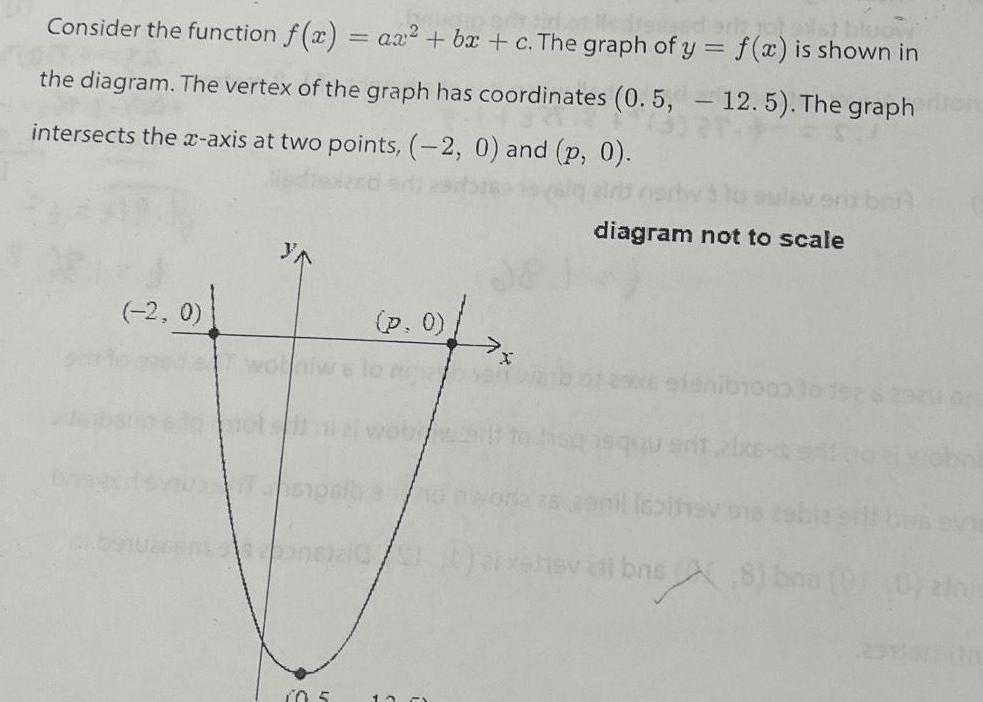
Consider the function f(x) = ax2 + bx + c. The graph of y = f(x) is shown in the diagram. The vertex of the graph has coordinates (0.5, -12.5). The graph intersects the x-axis at two points, (-2, 0) and (p, 0). diagram not to scale (-2, 0) (p. 0) 10 -
Step by Step Solution
There are 3 Steps involved in it
1 Expert Approved Answer
Step: 1 Unlock

Question Has Been Solved by an Expert!
Get step-by-step solutions from verified subject matter experts
Step: 2 Unlock
Step: 3 Unlock