

Question: Consider the given data 15 10 6 17 12 19 12 5 6 Use the least squares regression to fit a straight line to the
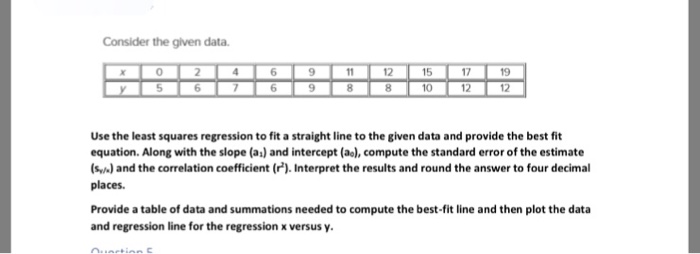
Consider the given data 15 10 6 17 12 19 12 5 6 Use the least squares regression to fit a straight line to the given data and provide the best fit equation. Along with the slope (a) and intercept (ao), compute the standard error of the estimate (sy) and the correlation coefficient (r). Interpret the results and round the answer to four decimal places. Provide a table of data and summations needed to compute the best-fit line and then plot the data and regression line for the regression x versus y
Step by Step Solution
There are 3 Steps involved in it
1 Expert Approved Answer
Step: 1 Unlock

Question Has Been Solved by an Expert!
Get step-by-step solutions from verified subject matter experts
Step: 2 Unlock
Step: 3 Unlock