

Question: Consider the given Figure 2.2. The values in each arc represent the path cost between two nodes. Heuristic cost from each node to the goal
Consider the given Figure 2.2. The values in each arc represent the path cost between two nodes. Heuristic cost from each node to the goal node W is shown in Table 2.1
(i) If P is the start node and W is the goal node, find the traversals and paths using,
- Uniform Cost Search algorithm
- Greedy Search algorithm
- A* Search Algorithm
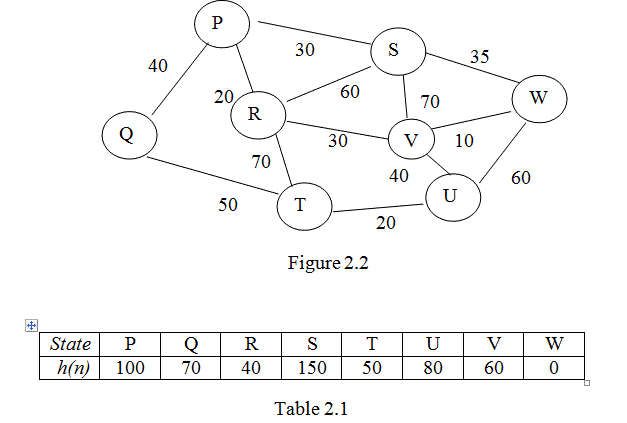
[ 3*4 Marks] (ii) Hence identify which search algorithm in part (i) provides the optimal solution? Give reasons.
P 30 S 35 40 60 20 R 70 W Q 30 V 10 70 40 60 U 50 T 20 Figure 2.2 State hin P 100 Q 70 R 40 S 150 T 50 U 80 V 60 W 0 Table 2.1
Step by Step Solution
There are 3 Steps involved in it
1 Expert Approved Answer
Step: 1 Unlock

Question Has Been Solved by an Expert!
Get step-by-step solutions from verified subject matter experts
Step: 2 Unlock
Step: 3 Unlock