

Question: Consider the graph at right, which shows the long-run aggregate supply (LAS) and the short-run aggregate supply (SAS) curves. 100 Suppose short-run equilibrium occurs above
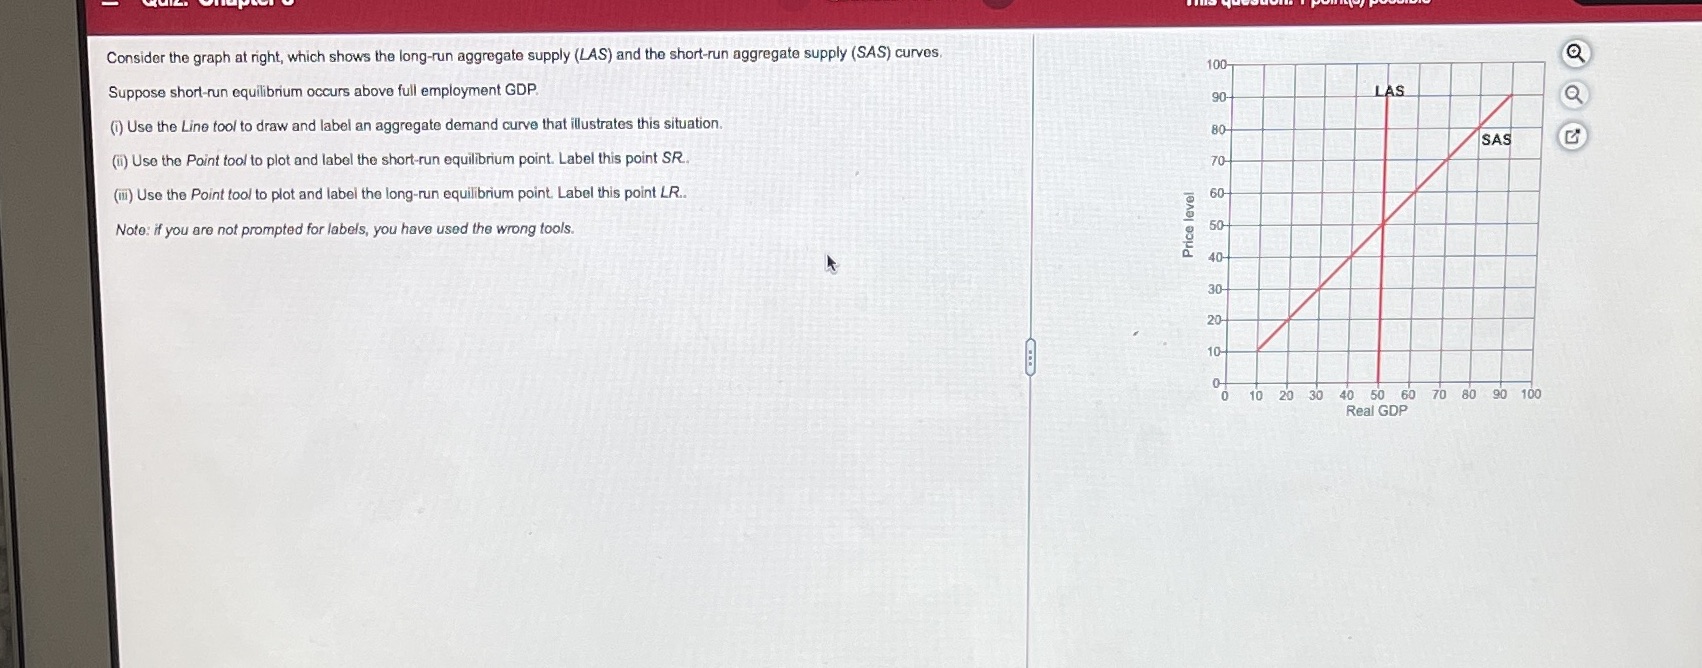

Consider the graph at right, which shows the long-run aggregate supply (LAS) and the short-run aggregate supply (SAS) curves. 100 Suppose short-run equilibrium occurs above full employment GDP. 90 LAS Q (1) Use the Line tool to draw and label an aggregate demand curve that illustrates this situation. SAS (ii) Use the Point tool to plot and label the short-run equilibrium point. Label this point SR. 70 (ill) Use the Point tool to plot and label the long-run equilibrium point. Label this point LR.. 60 Note: if you are not prompted for labels, you have used the wrong tools. Price level 50 40- 30 20 10 10 20 30 40 50 60 70 80 90 100 Real GDP
Step by Step Solution
There are 3 Steps involved in it

Get step-by-step solutions from verified subject matter experts