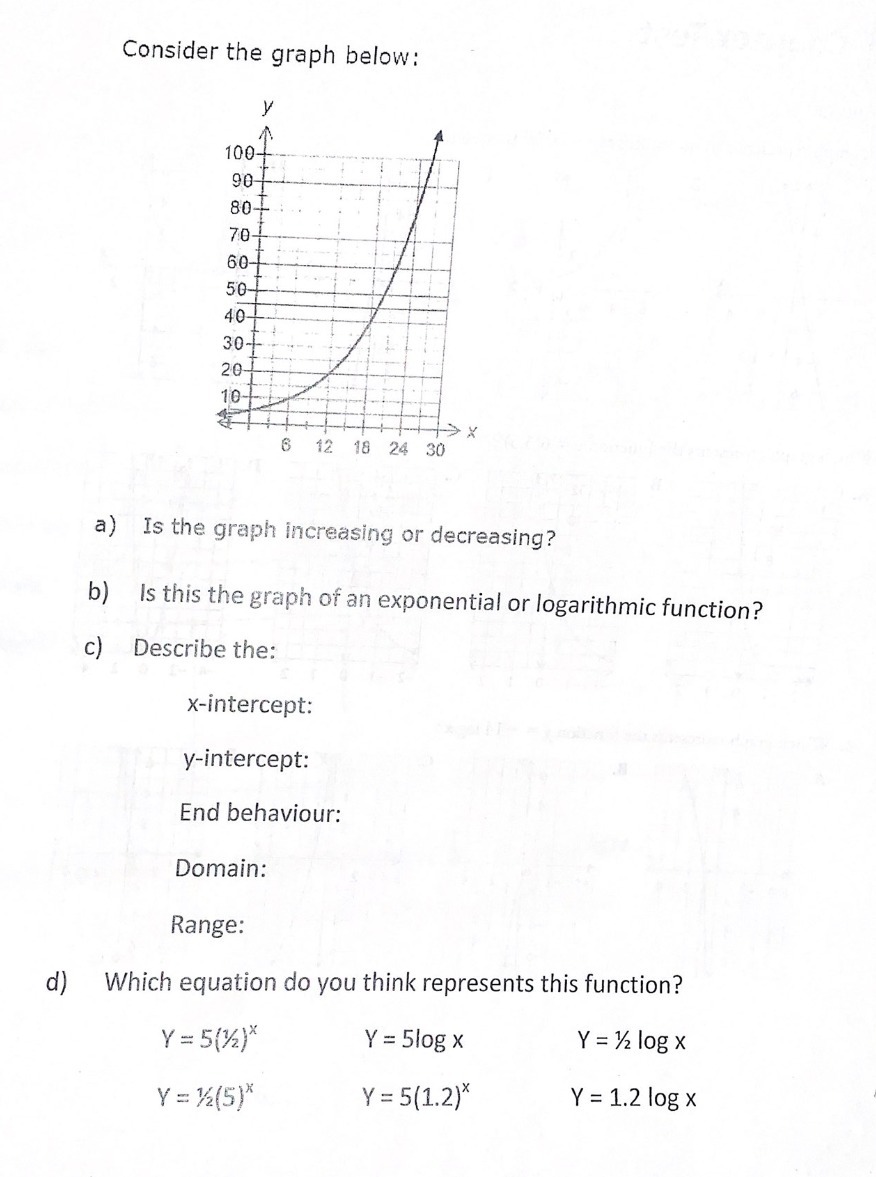
Question: Consider the graph below: 100- 90- 80-L 70 60- 50- 40- 30-4 20- 10- ->X 6 12 18 24 30 a) Is the graph increasing

Consider the graph below: 100- 90- 80-L 70 60-
Consider the graph below: 100- 90- 80-L 70 60- 50- 40- 30-4 20- 10- ->X 6 12 18 24 30 a) Is the graph increasing or decreasing? b) Is this the graph of an exponential or logarithmic function? c) Describe the: x-intercept: y-intercept: End behaviour: Domain: Range: d) Which equation do you think represents this function? Y = 5(12 ) X Y = 5log X Y = 1/2 log X Y = 12(5)* Y = 5(1.2)* Y = 1.2 log X

Step by Step Solution

There are 3 Steps involved in it

1 Expert Approved Answer
Step: 1 Unlock blur-text-image
Question Has Been Solved by an Expert!

Get step-by-step solutions from verified subject matter experts

Step: 2 Unlock
Step: 3 Unlock

Students Have Also Explored These Related Mathematics Questions!