

Question: Consider the graph below. System A cost $ 1 M and has an MTBF of 5 0 0 hours, System B cost $ 1 .
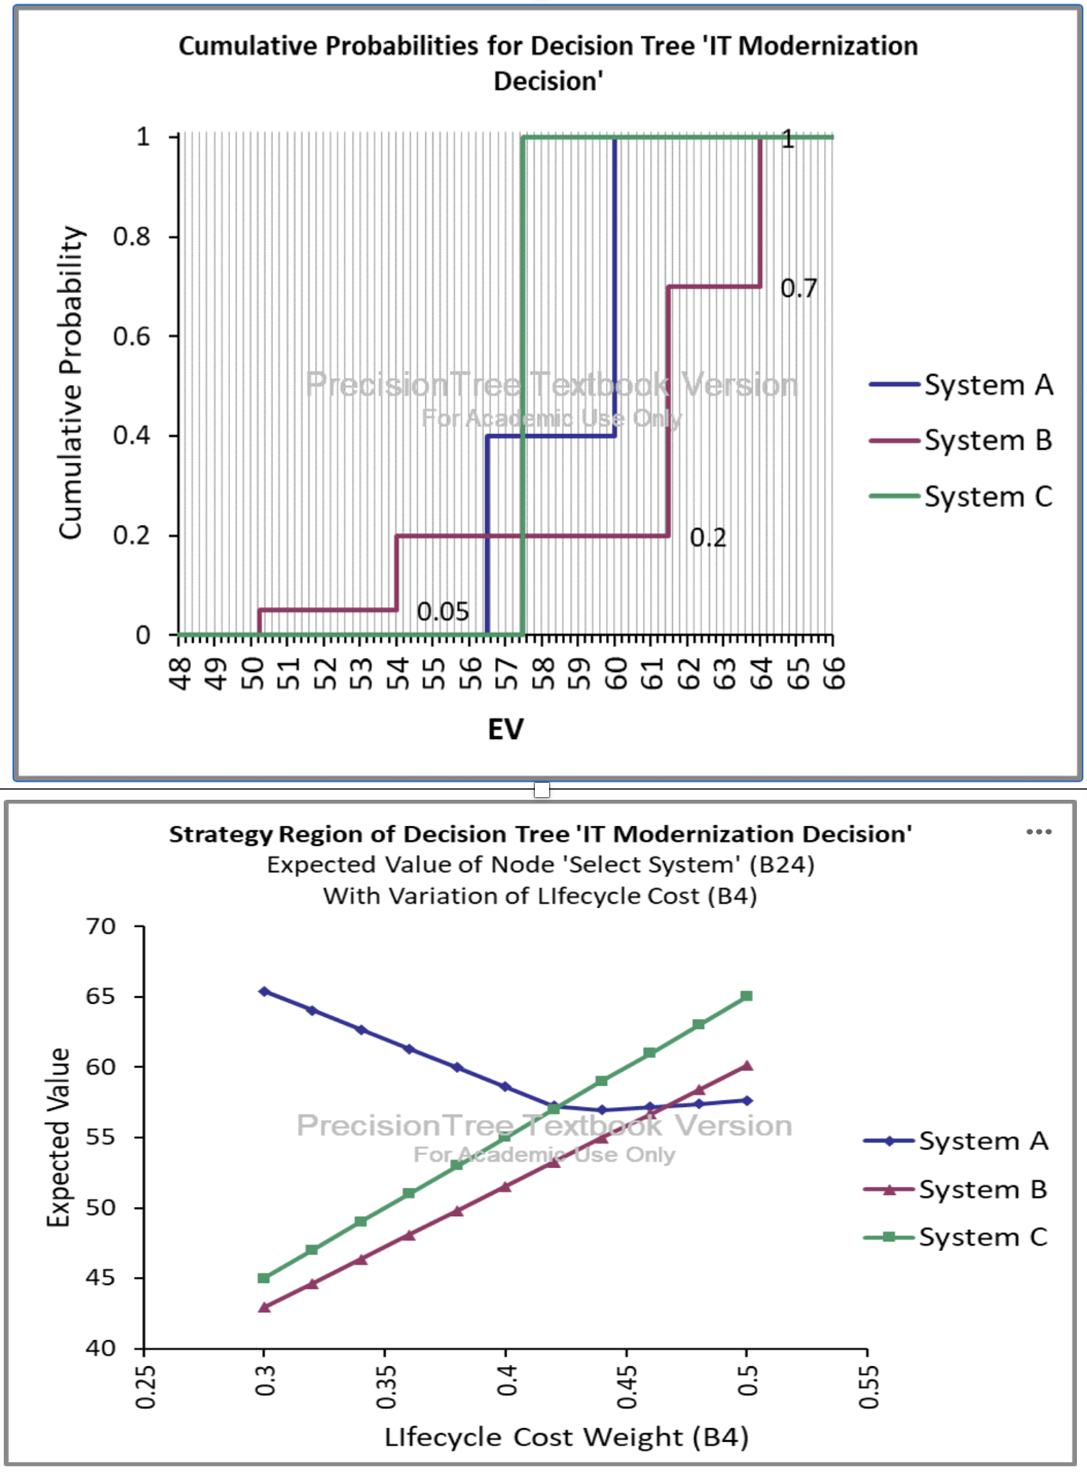
Consider the graph below. System A cost $M and has an MTBF of hours, System B cost $M and an MTBF of hours, Systems C cost $M and has an MTBF of hours, and Systems C cost $M and has an MTBF of If the weight for Life cycle cost is between and in what order would you rank the systems from best to worse to maximize expected value?
Neither system is dominant therefore no system is best.
B
ABC
Step by Step Solution
There are 3 Steps involved in it
1 Expert Approved Answer
Step: 1 Unlock

Question Has Been Solved by an Expert!
Get step-by-step solutions from verified subject matter experts
Step: 2 Unlock
Step: 3 Unlock