

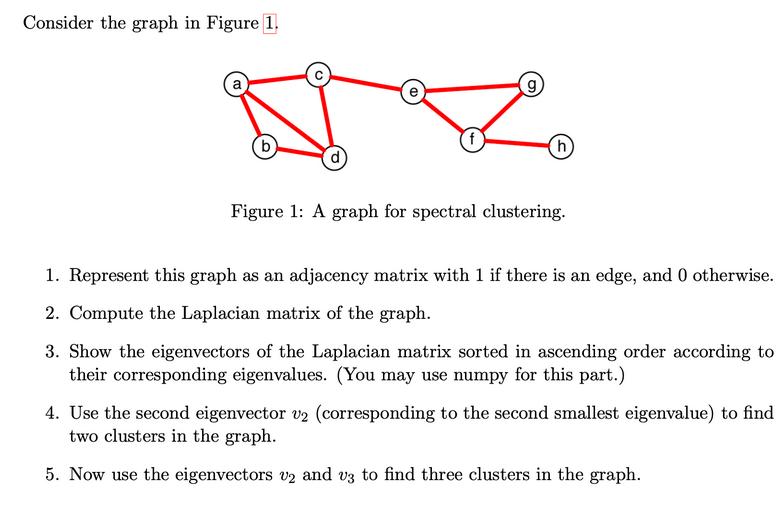
Consider the graph in Figure 1. b g (h) Figure 1: A graph for spectral clustering....
Fantastic news! We've Found the answer you've been seeking!
Question:
Expert Answer:

Related Book For 

Discrete and Combinatorial Mathematics An Applied Introduction
ISBN: 978-0201726343
5th edition
Authors: Ralph P. Grimaldi
Posted Date:
