

Question: Consider the graph shown below. 60 50 40 30 20 X 5 -4 -3 -2 -1 1 2 3 4 5 -10 20 30 40

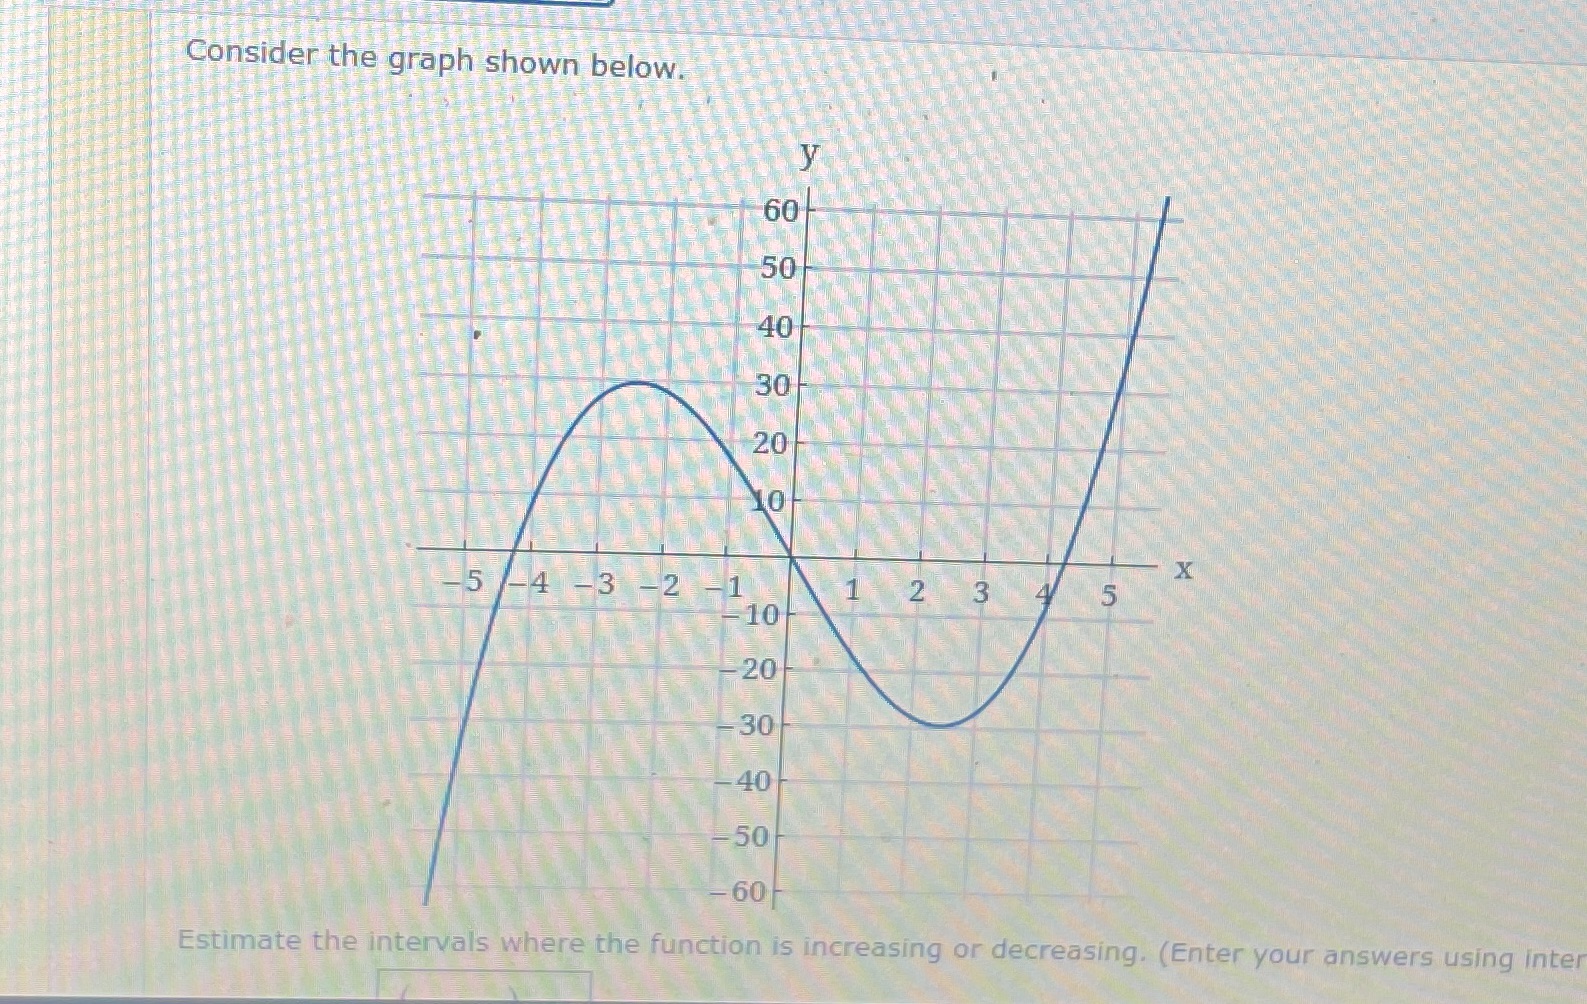
Consider the graph shown below. 60 50 40 30 20 X 5 -4 -3 -2 -1 1 2 3 4 5 -10 20 30 40 50 -60 Estimate the intervals where the function is increasing or decreasing. (Enter your answers using inter
Step by Step Solution
There are 3 Steps involved in it
1 Expert Approved Answer
Step: 1 Unlock

Question Has Been Solved by an Expert!
Get step-by-step solutions from verified subject matter experts
Step: 2 Unlock
Step: 3 Unlock