

Question: Consider the graph to the right that relates a person's height to their shoe size. a. In words, describe the function shown on the graph.
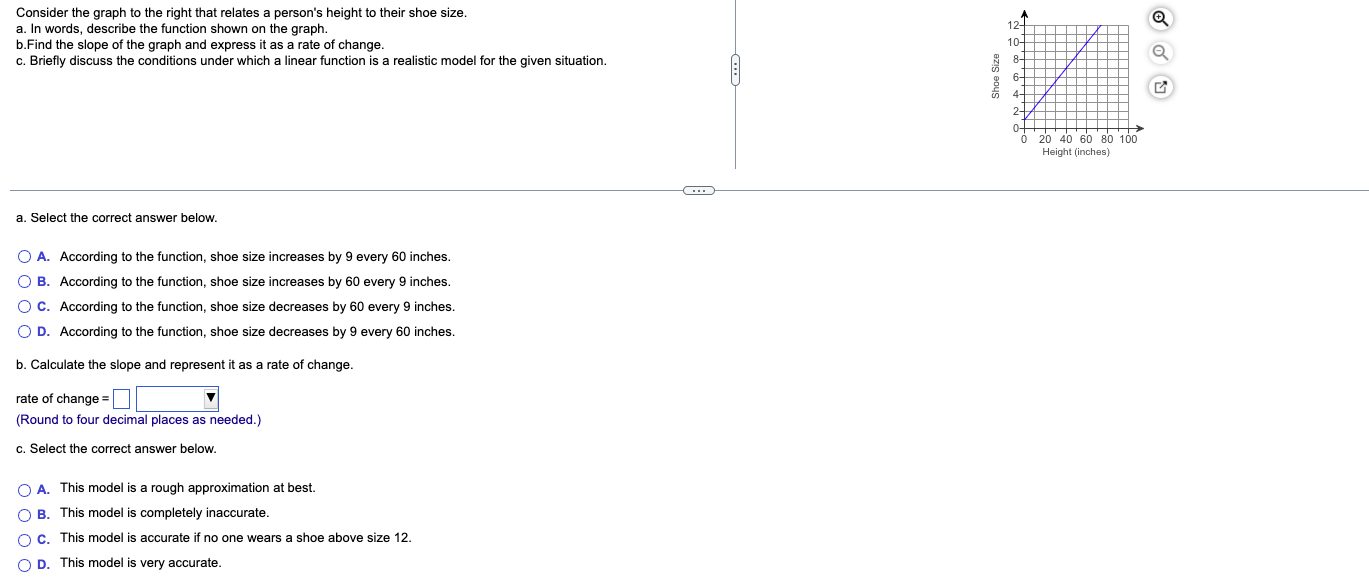
Consider the graph to the right that relates a person's height to their shoe size. a. In words, describe the function shown on the graph. b.Find the slope of the graph and express it as a rate of change. c. Briefly discuss the conditions under which a linear function is a realistic model for the given situation. Shoe Size 20 40 60 80 100 Height (inches) a. Select the correct answer below. O A. According to the function, shoe size increases by 9 every 60 inches. O B. According to the function, shoe size increases by 60 every 9 inches. O C. According to the function, shoe size decreases by 60 every 9 inches. O D. According to the function, shoe size decreases by 9 every 60 inches. b. Calculate the slope and represent it as a rate of change. rate of change = (Round to four decimal places as needed.) c. Select the correct answer below. O A. This model is a rough approximation at best. O B. This model is completely inaccurate. O C. This model is accurate if no one wears a shoe above size 12. O D. This model is very accurate
Step by Step Solution
There are 3 Steps involved in it

Get step-by-step solutions from verified subject matter experts