

Question: Consider the graph, which illustrates the demand for Fluff. Fluif can be produced at a constant marginal and average total cost of $4 per case.
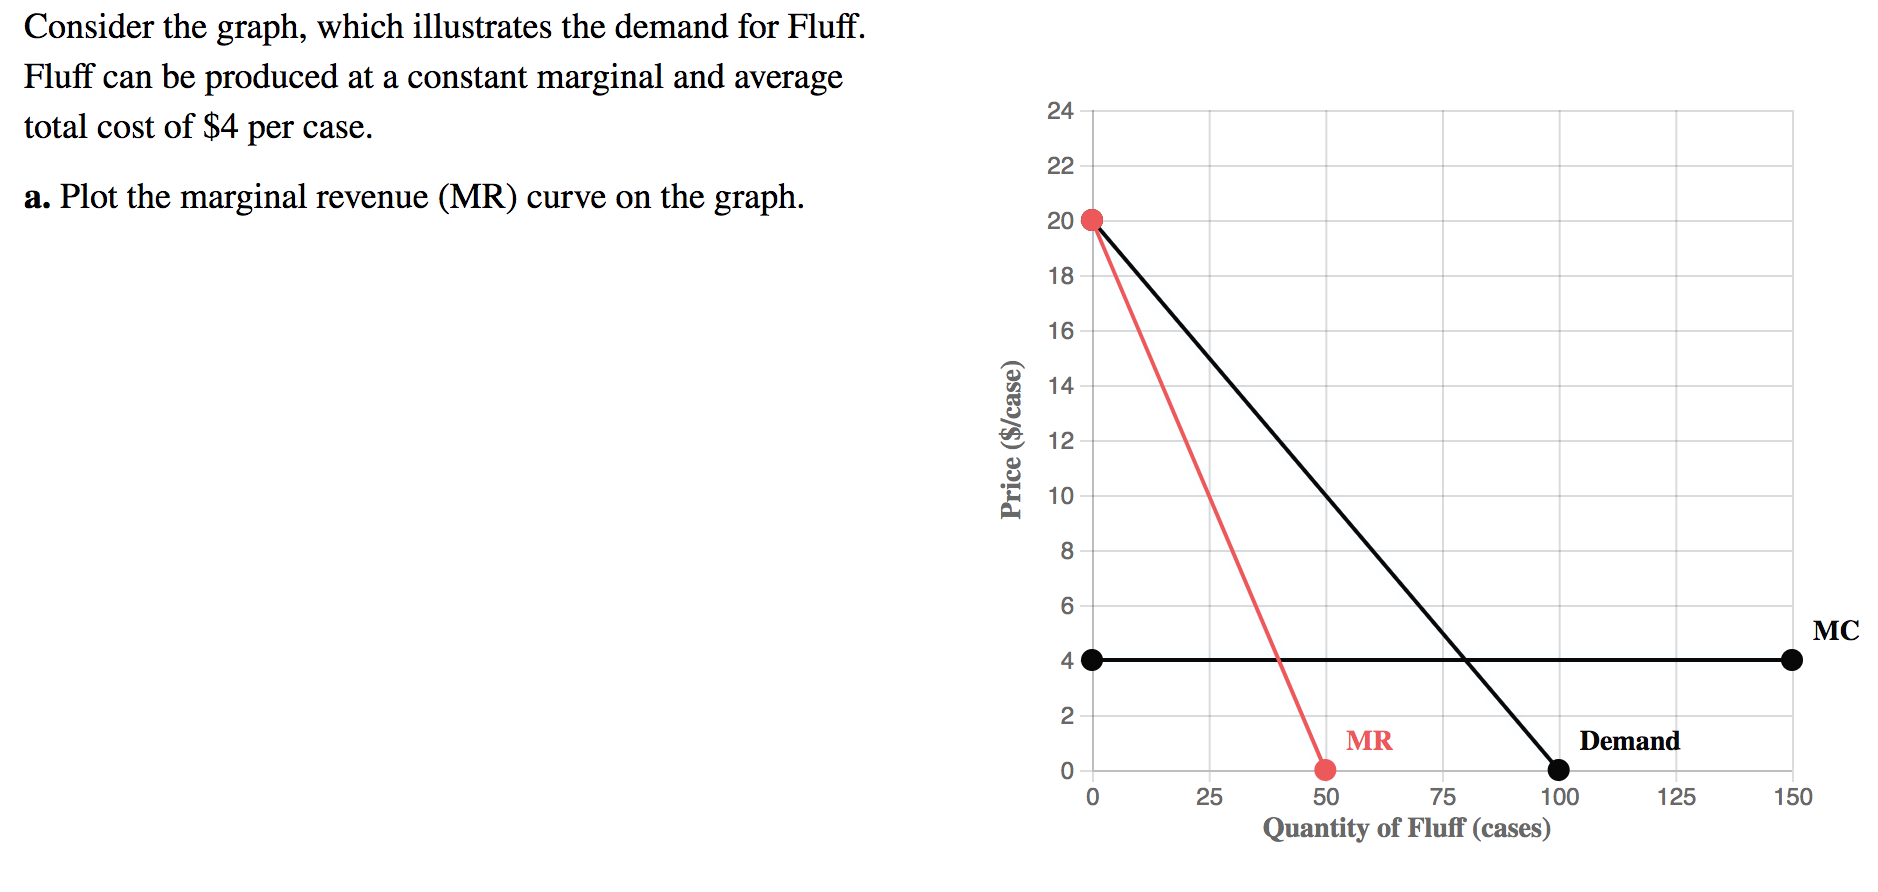
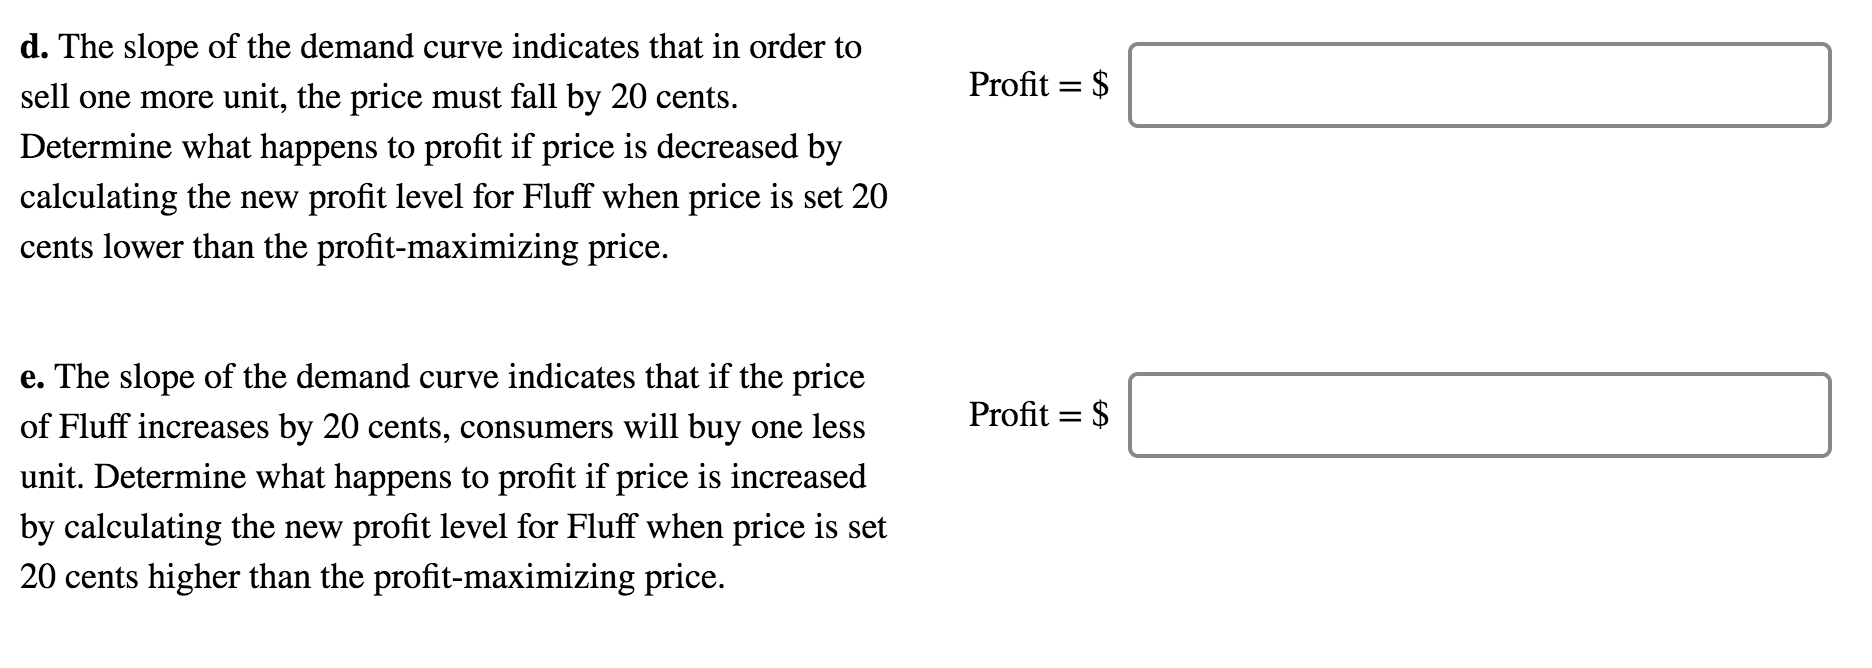
Consider the graph, which illustrates the demand for Fluff. Fluif can be produced at a constant marginal and average total cost of $4 per case. a. Plot the marginal revenue (MR) curve on the graph. Price (ES/case) 24 22 2O .1. _l _L 25 50 75 1 00 Quantity of Fluff (cases) 125 150 d. The slope of the demand curve indicates that in order to sell one more unit, the price must fall by 20 cents. Determine what happens to prot if price is decreased by calculating the new prot level for Fluff when price is set 20 cents lower than the protmaximizing price. e. The slope of the demand curve indicates that if the price of Fluff increases by 20 cents, consumers will buy one less unit. Determine what happens to prot if price is increased by calculating the new prot level for Fluff when price is set 20 cents higher than the prot-maximizing price. Prot = $ Prot = $
Step by Step Solution
There are 3 Steps involved in it

Get step-by-step solutions from verified subject matter experts