

Question: Consider the logistic differential equation Q _ dt :TP( K) This is the equation used to describe population growth in the presence of constraints rst

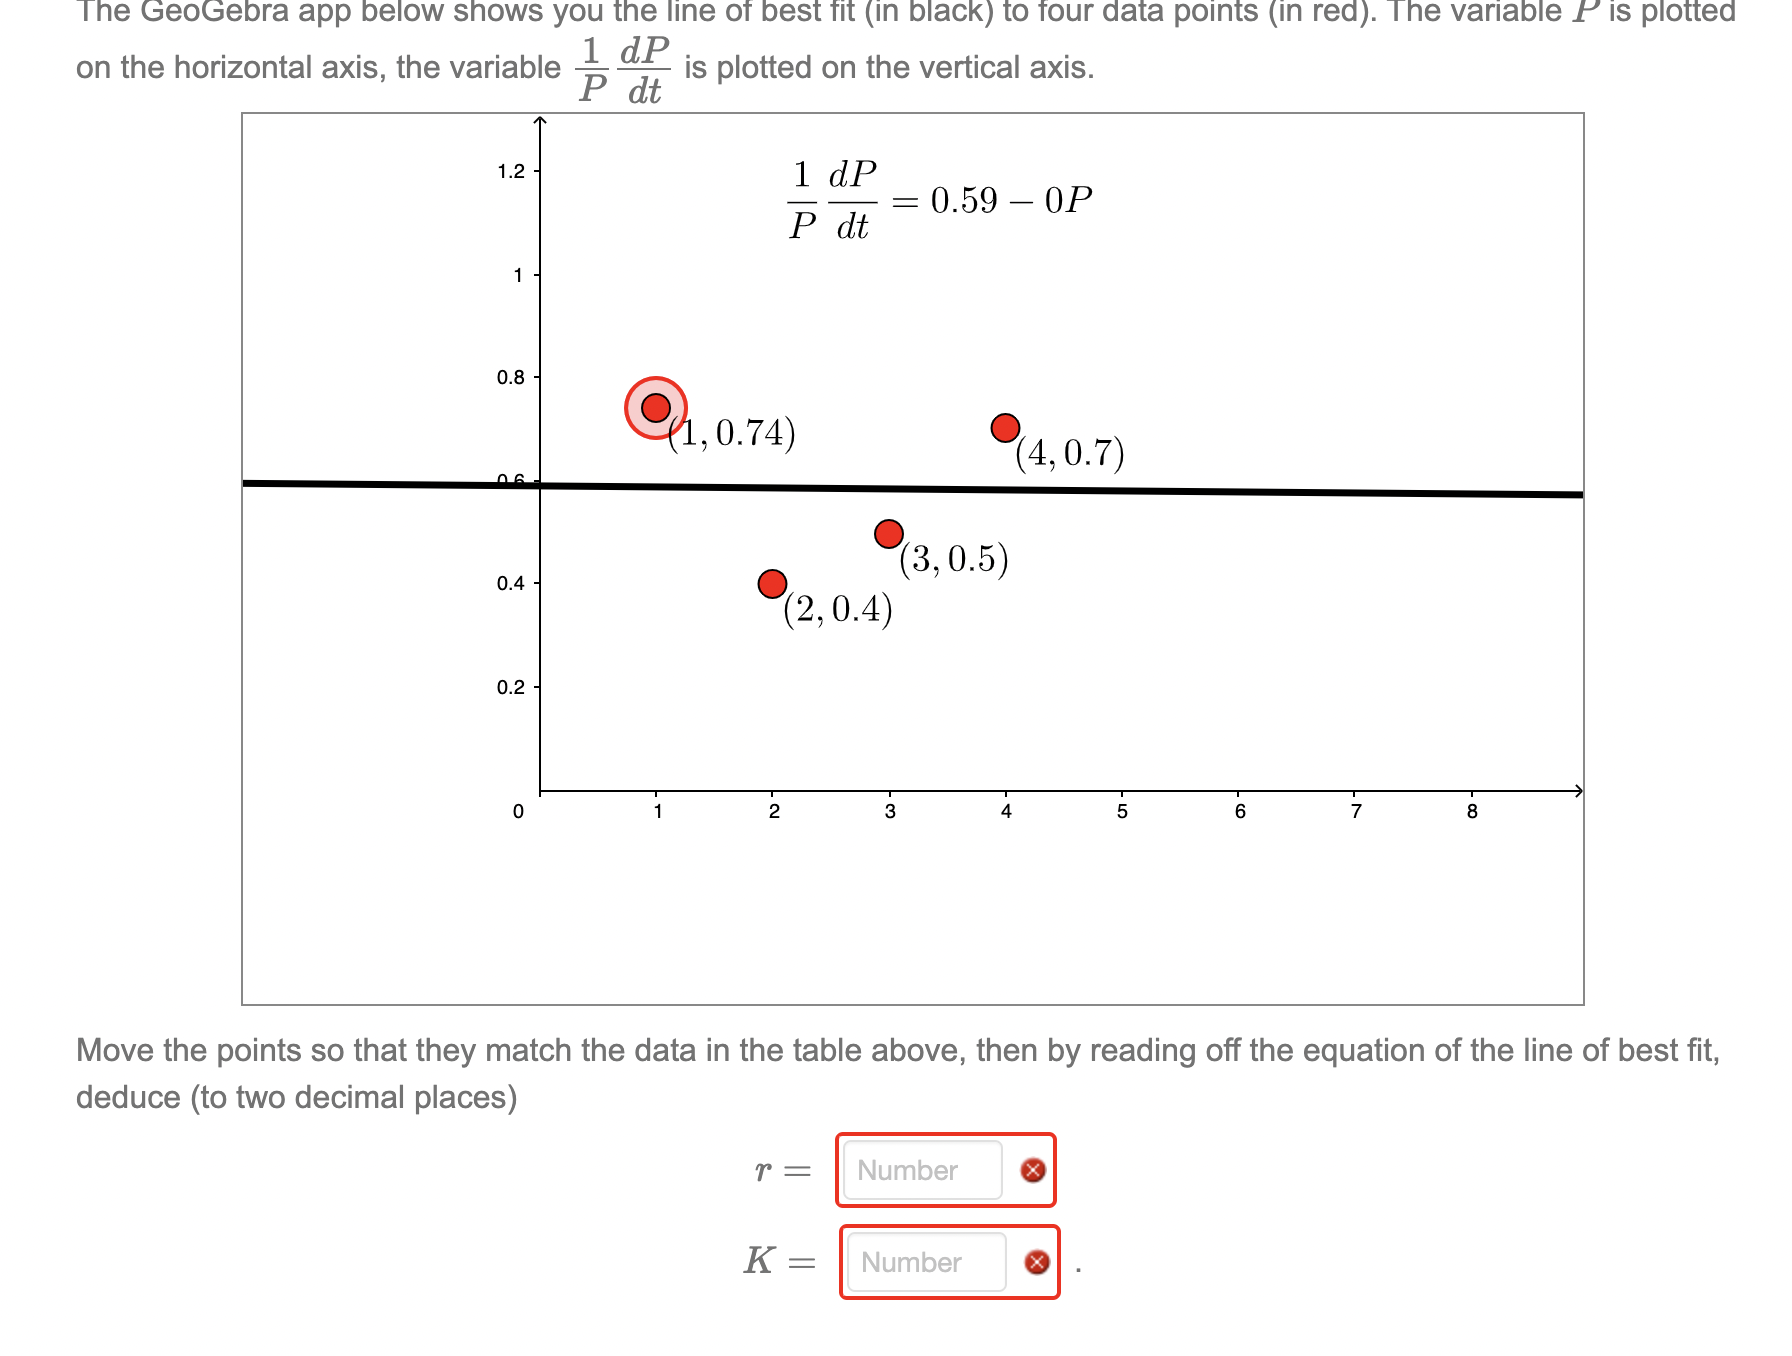
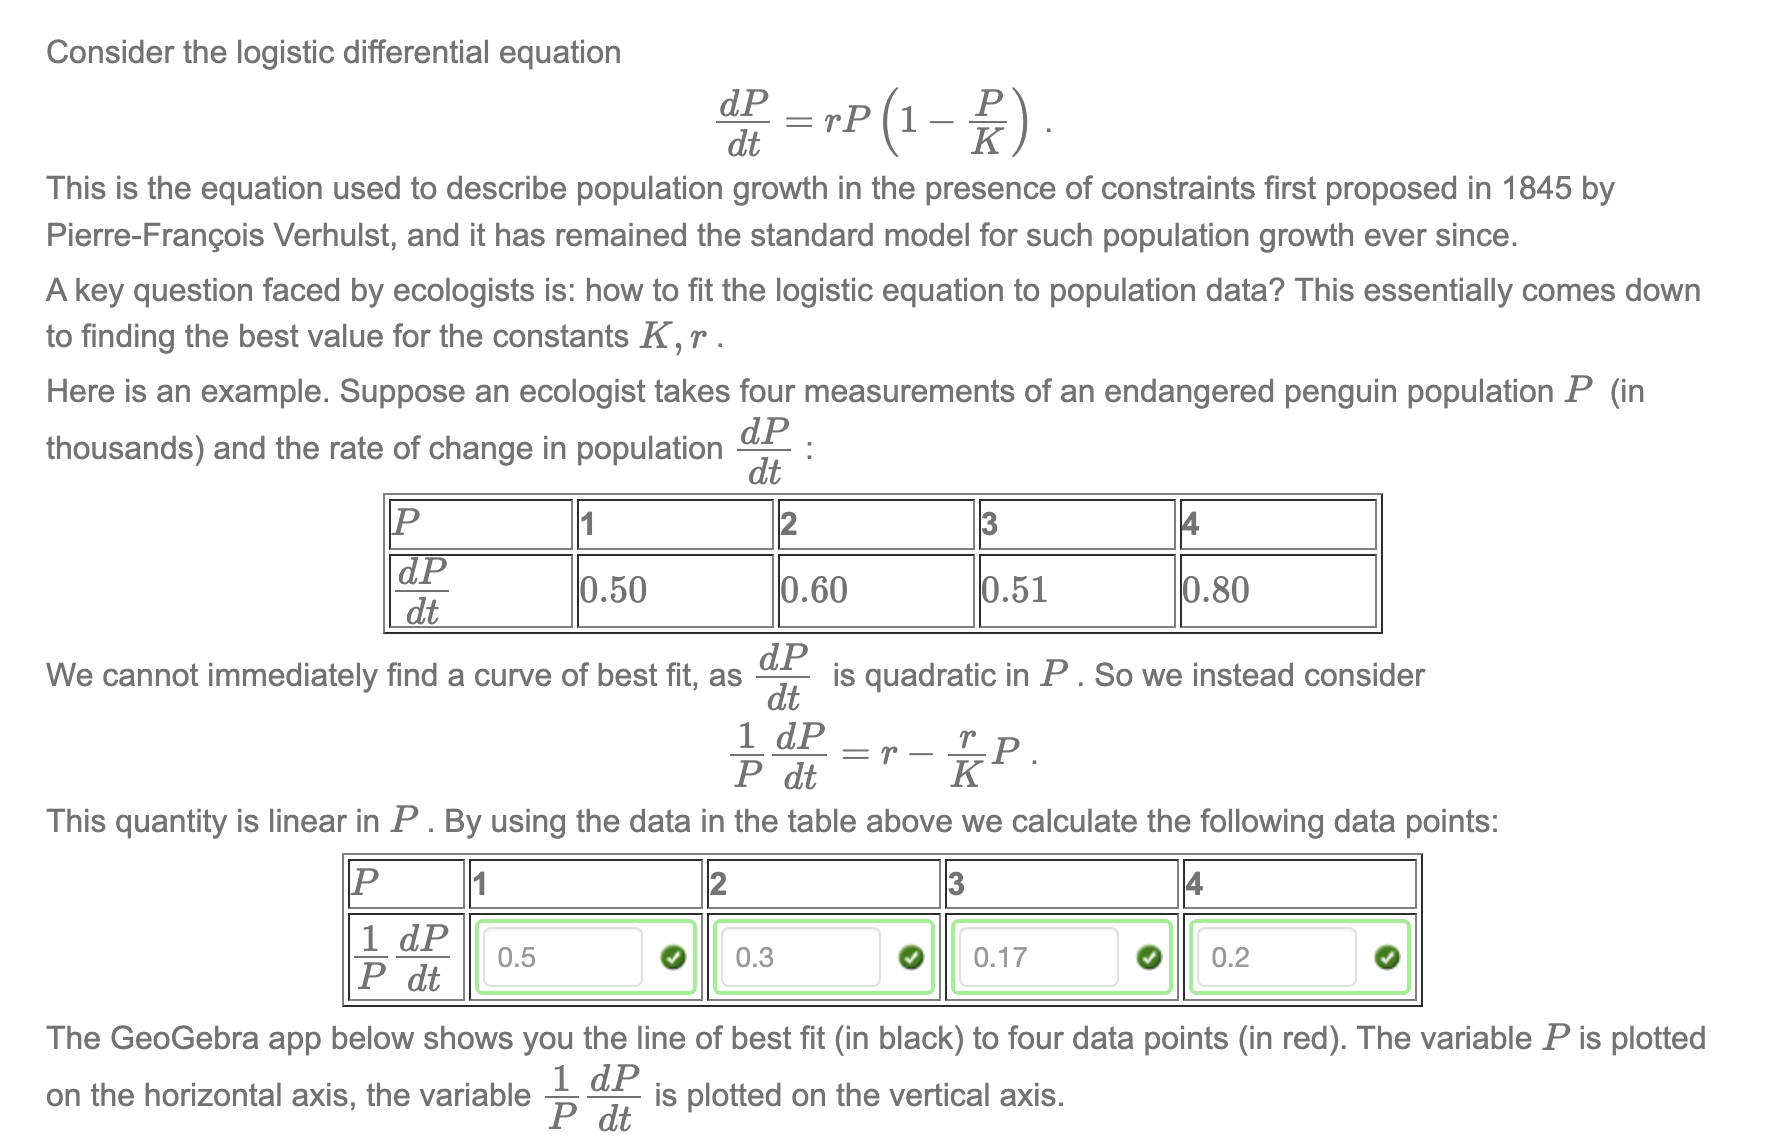

Consider the logistic differential equation Q _ dt :TP( K)\" This is the equation used to describe population growth in the presence of constraints rst proposed in 1845 by Pierre-Francois Verhulst, and it has remained the standard model for such population growth ever since. A key question faced by ecologists is: how to fit the logistic equation to population data? This essentially comes down to nding the best value for the constants K, r- . Here is an example. Suppose an ecologist takes four measurements of an endangered penguin population P (in d_PI dt |P_|1|2_| |_l4_l % 0.50 0.60 0.51 0.80 thousands) and the rate of change in population We cannot immediately find a curve of best fit, as is quadratic' In P. So we instead consider (if The GeoGebra app below shows you the line of best fit (in black) to four data points (in red). The variable P is plotted 1 d_P- Pdt on the horizontal axis, the variable is plotted on the vertical axis. The GeoGebra app below ShOWS yOU the line 01' best Tit (in black) to Tour data points (in red). The variable I" is plotted on the horizontal axis, the variable % % is plotted on the vertical axis. 1-2 ' 1 dP = 0.59 OF P dt Move the points so that they match the data in the table above, then by reading off the equation of the line of best fit, deduce (to two decimal places)
Step by Step Solution
There are 3 Steps involved in it

Get step-by-step solutions from verified subject matter experts