

Question: Consider the partially completed Excel regression analysis shown below between the independent variable rental property area (in square feet) and the dependent variable monthly rent

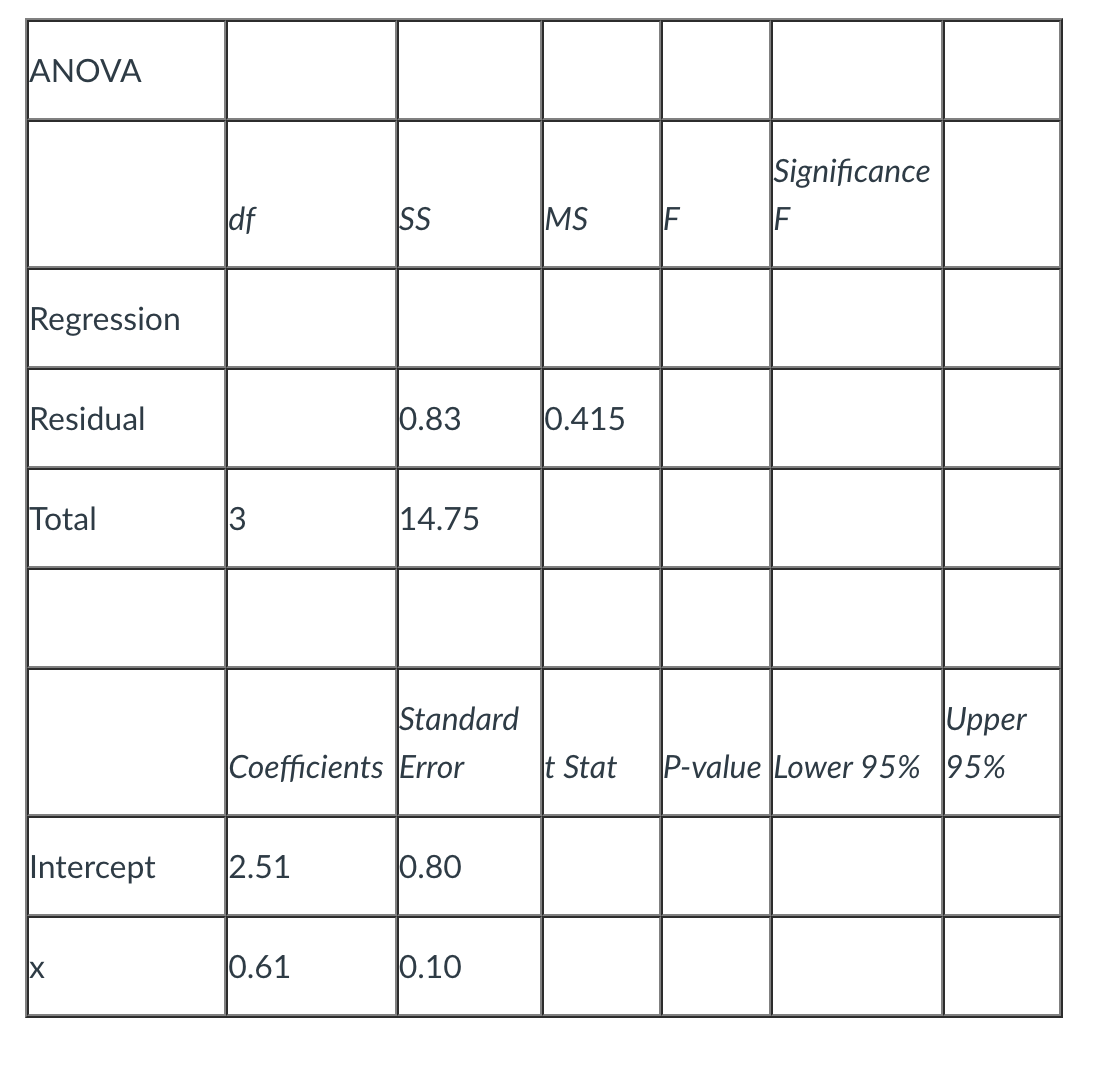
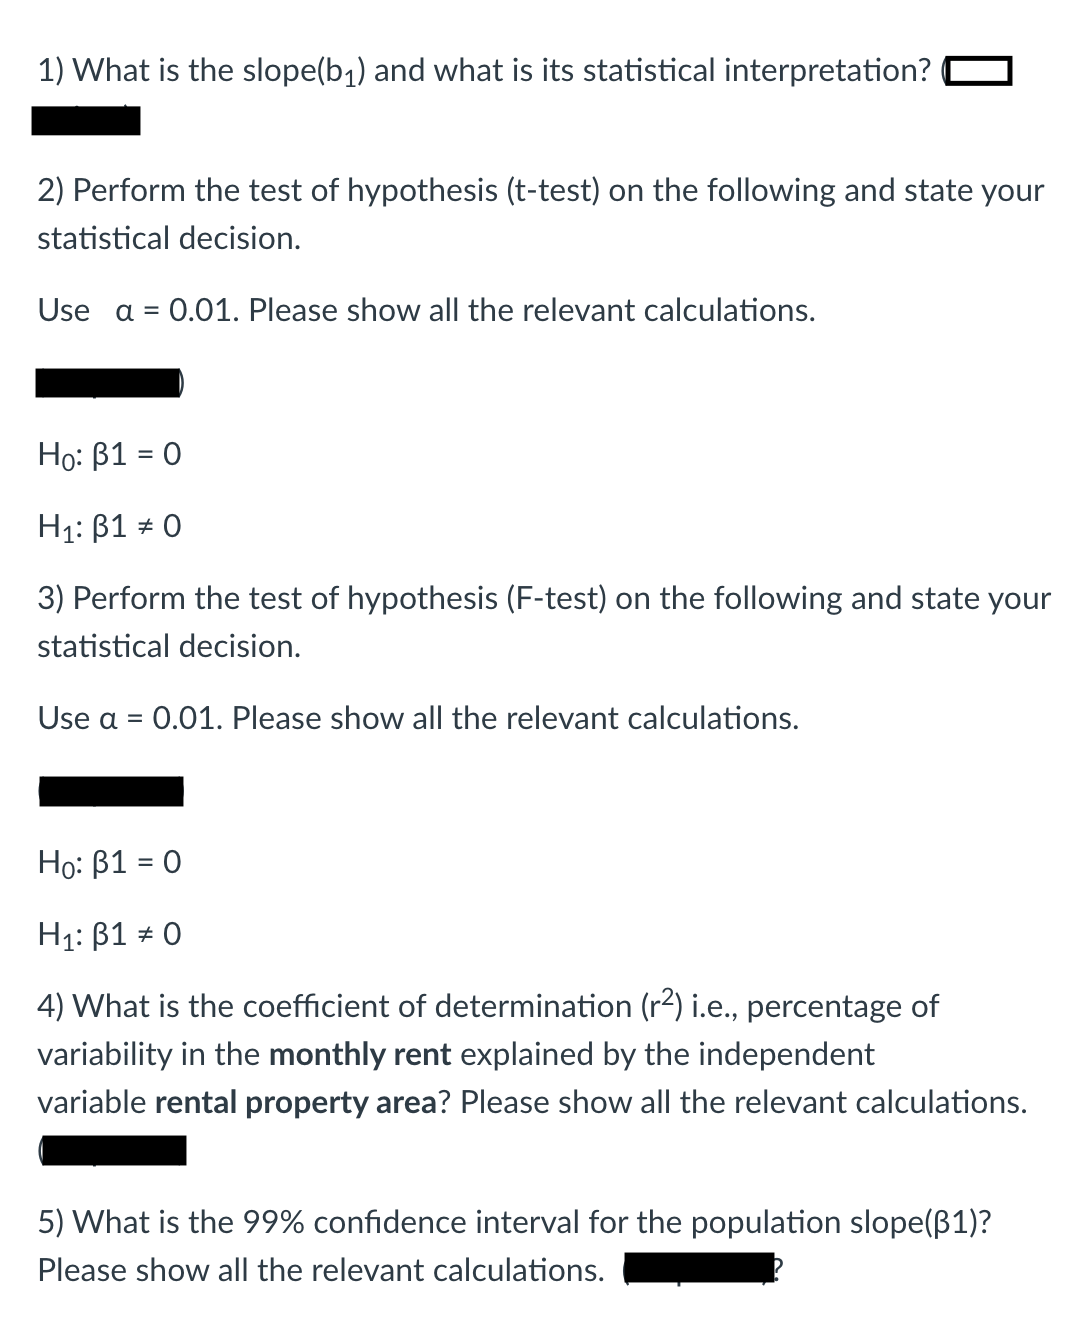
Consider the partially completed Excel regression analysis shown below between the independent variable rental property area (in square feet) and the dependent variable monthly rent (in dollars) and answer the following questions. Regression Statistics Multiple R R Square * djusted R Square Standard Error Observations ANOVA Significance df SS MS IF Regression Residual 0.83 0.415 Total 3 14.75 Standard Upper Coefficients Error t Stat P-value Lower 95% 95% Intercept 2.51 0.80 X 0.61 0.101) What is the slope(b1) and what is its statistical interpretation? 2) Perform the test of hypothesis (t-test) on the following and state your statistical decision. Use a = 0.01. Please show all the relevant calculations. Ho: B1 = 0 H1: B1 # 0 3) Perform the test of hypothesis (F-test) on the following and state your statistical decision. Use a = 0.01. Please show all the relevant calculations. Ho: B1 = 0 H1: B1 = 0 4) What is the coefficient of determination (r2) i.e., percentage of variability in the monthly rent explained by the independent variable rental property area? Please show all the relevant calculations. 5) What is the 99% confidence interval for the population slope(B1)? Please show all the relevant calculations
Step by Step Solution
There are 3 Steps involved in it

Get step-by-step solutions from verified subject matter experts