

Question: Consider the population described by the probability distribution shown in the table. The random variable x is observed twice. If these observations are independent, all
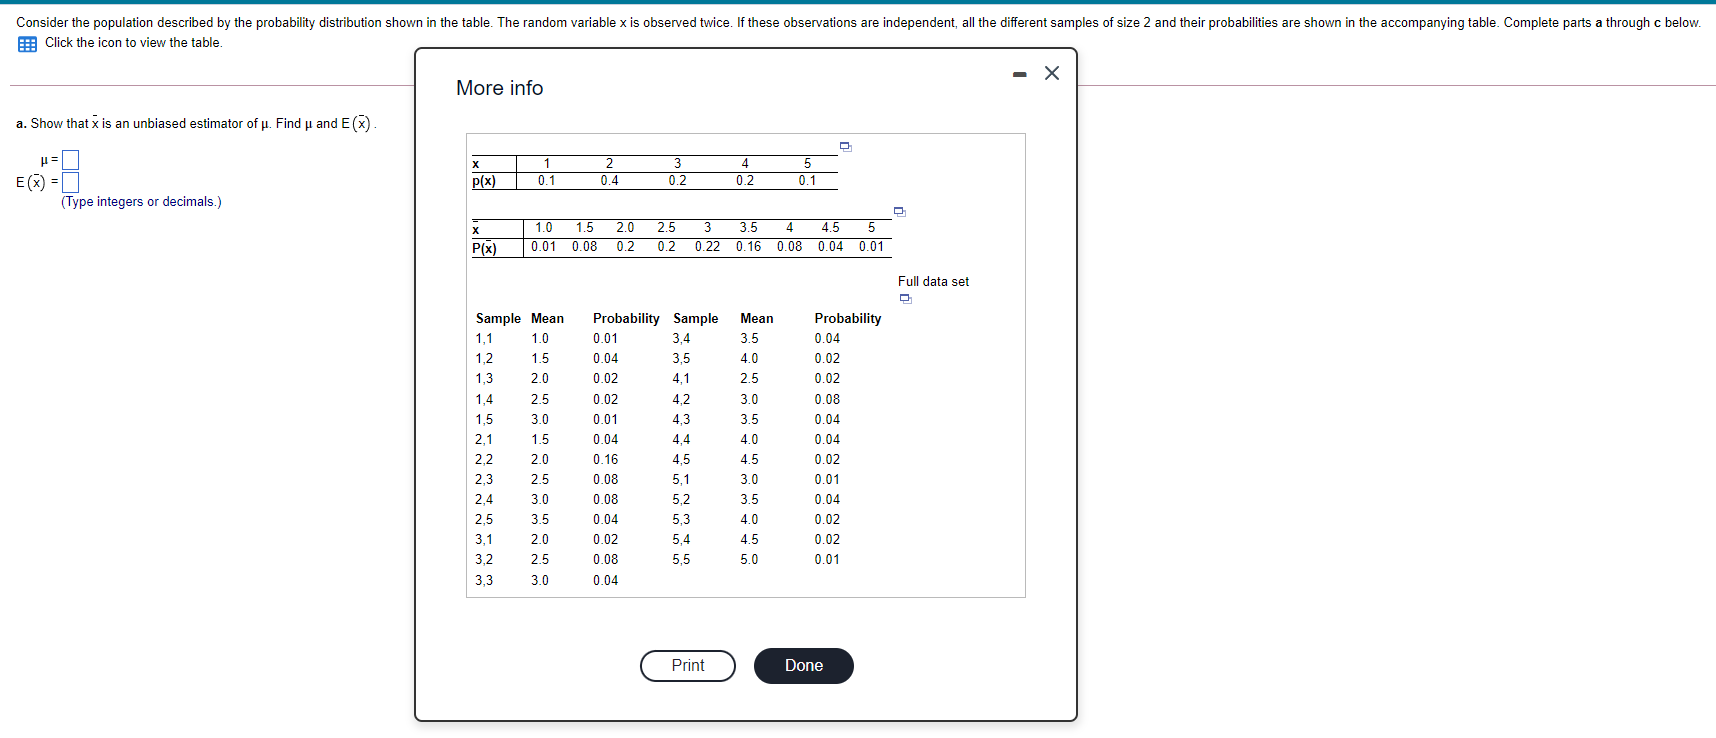

Consider the population described by the probability distribution shown in the table. The random variable x is observed twice. If these observations are independent, all the different samples of size 2 and their probabilities are shown in the accompanying table. Complete parts a through c below. Click the icon to view the table. - X More info a. Show that x is an unbiased estimator of u. Find u and E (x) . 2 3 4 5 p(x) 0.1 0.4 0.2 0.2 0.1 E (x) = (Type integers or decimals.) 1.0 1.5 2.0 2.5 3 3.5 4 4.5 5 P(x) 0.01 0.08 0.2 0.2 0.22 0.16 0.08 0.04 0.01 Full data set Sample Mean Probability Sample Mean Probability 1,1 1.0 0.01 3,4 3.5 0.04 1,2 1.5 0.04 3.5 4.0 0.02 1.3 20 ).02 41 25 0.02 1,4 2.5 0.0 4,2 3.0 0.08 1,5 3.0 0.01 4,3 3.5 0.04 2,1 1.5 0.04 4,4 4.0 0.04 2,2 2.0 0.16 4,5 4.5 0.02 2,3 2.5 0.08 5,1 3.0 0.01 2,4 3.0 0.08 5,2 3.5 0.04 2,5 3.5 0.04 5,3 40 0.02 3,1 2.0 0.02 5,4 45 0.02 3,2 2.5 0.08 5.5 50 0.01 3.3 3.0 0.04 Print Done
Step by Step Solution
There are 3 Steps involved in it

Get step-by-step solutions from verified subject matter experts