

Question: Consider the probability distributions you have studied so far. Which of the following distributions apply to discrete random variables? (Select all that apply.) Binomial Distribution
Consider the probability distributions you have studied so far.
Which of the following distributions apply to discrete random variables? (Select all that apply.)
Binomial Distribution
Poisson Distribution
Geometric Distribution
Normal Distribution
Which apply to continuous random variables? (Select all that apply.)
Binomial Distribution
Poisson Distribution
Geometric Distribution
Normal Distribution
Under what conditions can the binomial distribution be approximated by the normal? Letnbe the number of trials,pbe the probability of success on each trial, andq= 1?p.
n?30
n?100 andnp?10
n?100 andnp
np>5 andnq>5
np?5 andnq?5
Under what conditions can the binomial distribution be approximated by the Poisson? Letnbe the number of trials,pbe the probability of success on each trial, andq= 1?p.
(Select all that apply.)
n?30
n?100 andnp?10
n?100 andnp
np>5 andnq>5
np?5 andnq?5
Although older Americans are most afraid of crime, it is young people who are more likely to be the actual victims of crime. It seems that older people are more cautious about the people with whom they associate. A national survey showed that 10% of all peopleages 16-19have been victims of crime.?At Jefferson High School, a random sample ofn=67students
(ages 16-19)showed thatr=10
had been victims of a crime.Note: For degrees of freedom d.f. not in the Student'sttable,use the closest d.f. that is smaller. In some situations, this choice of d.f. may increase theP-valuea small amount and thereby produce a slightly more "conservative" answer.
State the null and alternate hypotheses.
H0:?= 0.10;H1:?> 0.10
H0:p= 0.10;H1:p> 0.10
H0:?= 0.10;H1:??0.10
H0:p= 0.10;H1:p?0.10
H0:p= 0.10;H1:p
H0:?= 0.10;H1:?
(ii) What sampling distribution will you use? What assumptions are you making?
The standard normal, sincenpnq
The Student'st, sincenpnq
The Student'st, sincenp> 5 andnq> 5.
The standard normal, sincenp> 5 andnq> 5.
What is the value of the sample test statistic? (Round your answer to two decimal places.)
(iii) Find (or estimate) theP-value.
P-value > 0.500
0.250 P-value
0.100 P-value
0.050 P-value
0.010 P-value
P-value
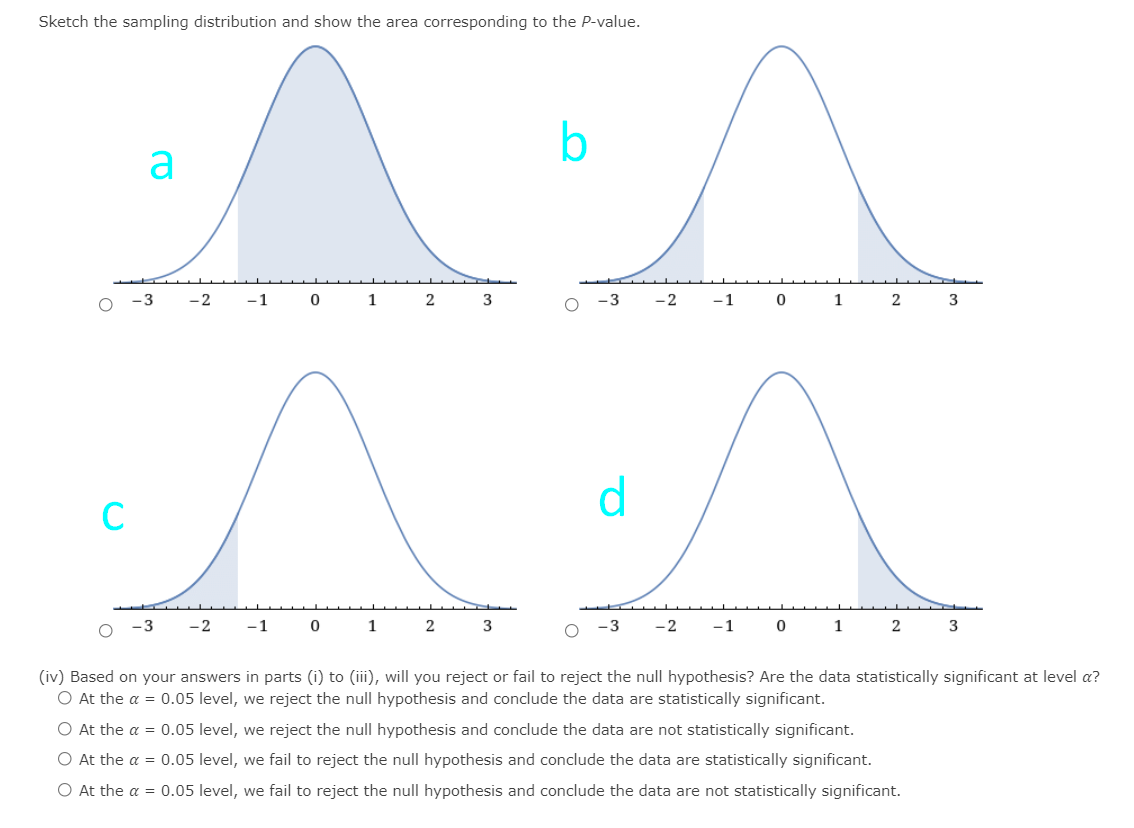
Sketch the sampling distribution and show the area corresponding to the Pvalue. O 3 -2 1 0 1 2 3 O 3 -2 1 0 1 2 3 O 3 -2 1 0 1 2 3 O 3 -2 1 0 1 2 3 (iv) Based on your answers in parts (i) to (iii), will you reject or fail to reject the null hypothesis? Are the data statistically signicant at level a? 0 At the a. = 0.05 level, we reject the null hypothesis and conclude the data are statistically signicant. 0 At the a. = 0.05 level, we reject the null hypothesis and conclude the data are not statistically signicant. 0 At the a. = 0.05 level, we fail to reject the null hypothesis and conclude the data are statistically signicant. 0 At the a. = 0.05 level, we fail to reject the null hypothesis and conclude the data are not statistically significant
Step by Step Solution
There are 3 Steps involved in it

Get step-by-step solutions from verified subject matter experts