

Question: Consider the question: A recent study found that the age of cars on road in 2013 is normally distributed with an average age of 8.3
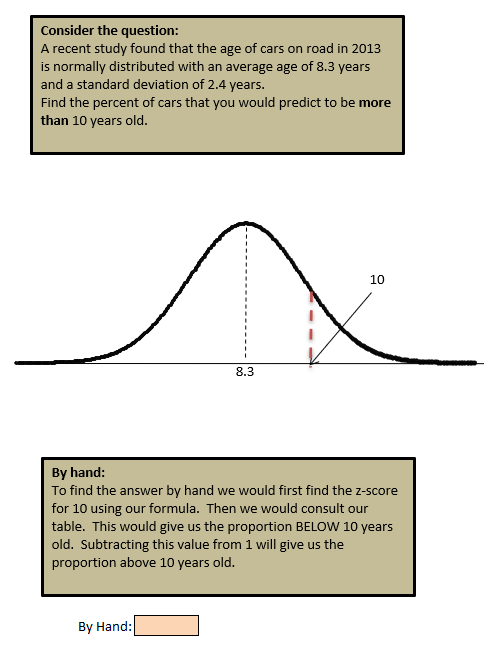


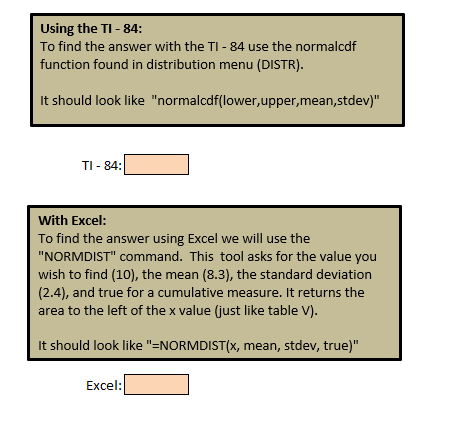
Consider the question: A recent study found that the age of cars on road in 2013 is normally distributed with an average age of 8.3 years and a standard deviation of 2.4 years. Find the percent of cars that you would predict to be more than 10 years old. 10 8.3 By hand: To find the answer by hand we would first find the z-score for 10 using our formula. Then we would consult our table. This would give us the proportion BELOW 10 years old. Subtracting this value from 1 will give us the proportion above 10 years old. By Hand:Using the TI - 84: To find the answer with the TI - 84 use the normalcdf function found in distribution menu (DISTRJ. It should look like "normalcdf(lower, upper, mean,stdev)" TI - 84 With Excel: To find the answer using Excel we will use the "NORMDIST" command. This tool asks for the value you wish to find (10), the mean (8.3), the standard deviation (2.4), and true for a cumulative measure. It returns the area to the left of the x value (just like table V). It should look like "=NORMDIST(x, mean, stdev, true)" Excel
Step by Step Solution
There are 3 Steps involved in it

Get step-by-step solutions from verified subject matter experts