

Question: Consider the reaction data. A products What two points should be plotted to graphically determine the activation energy of this reaction? To avoid rounding errors,
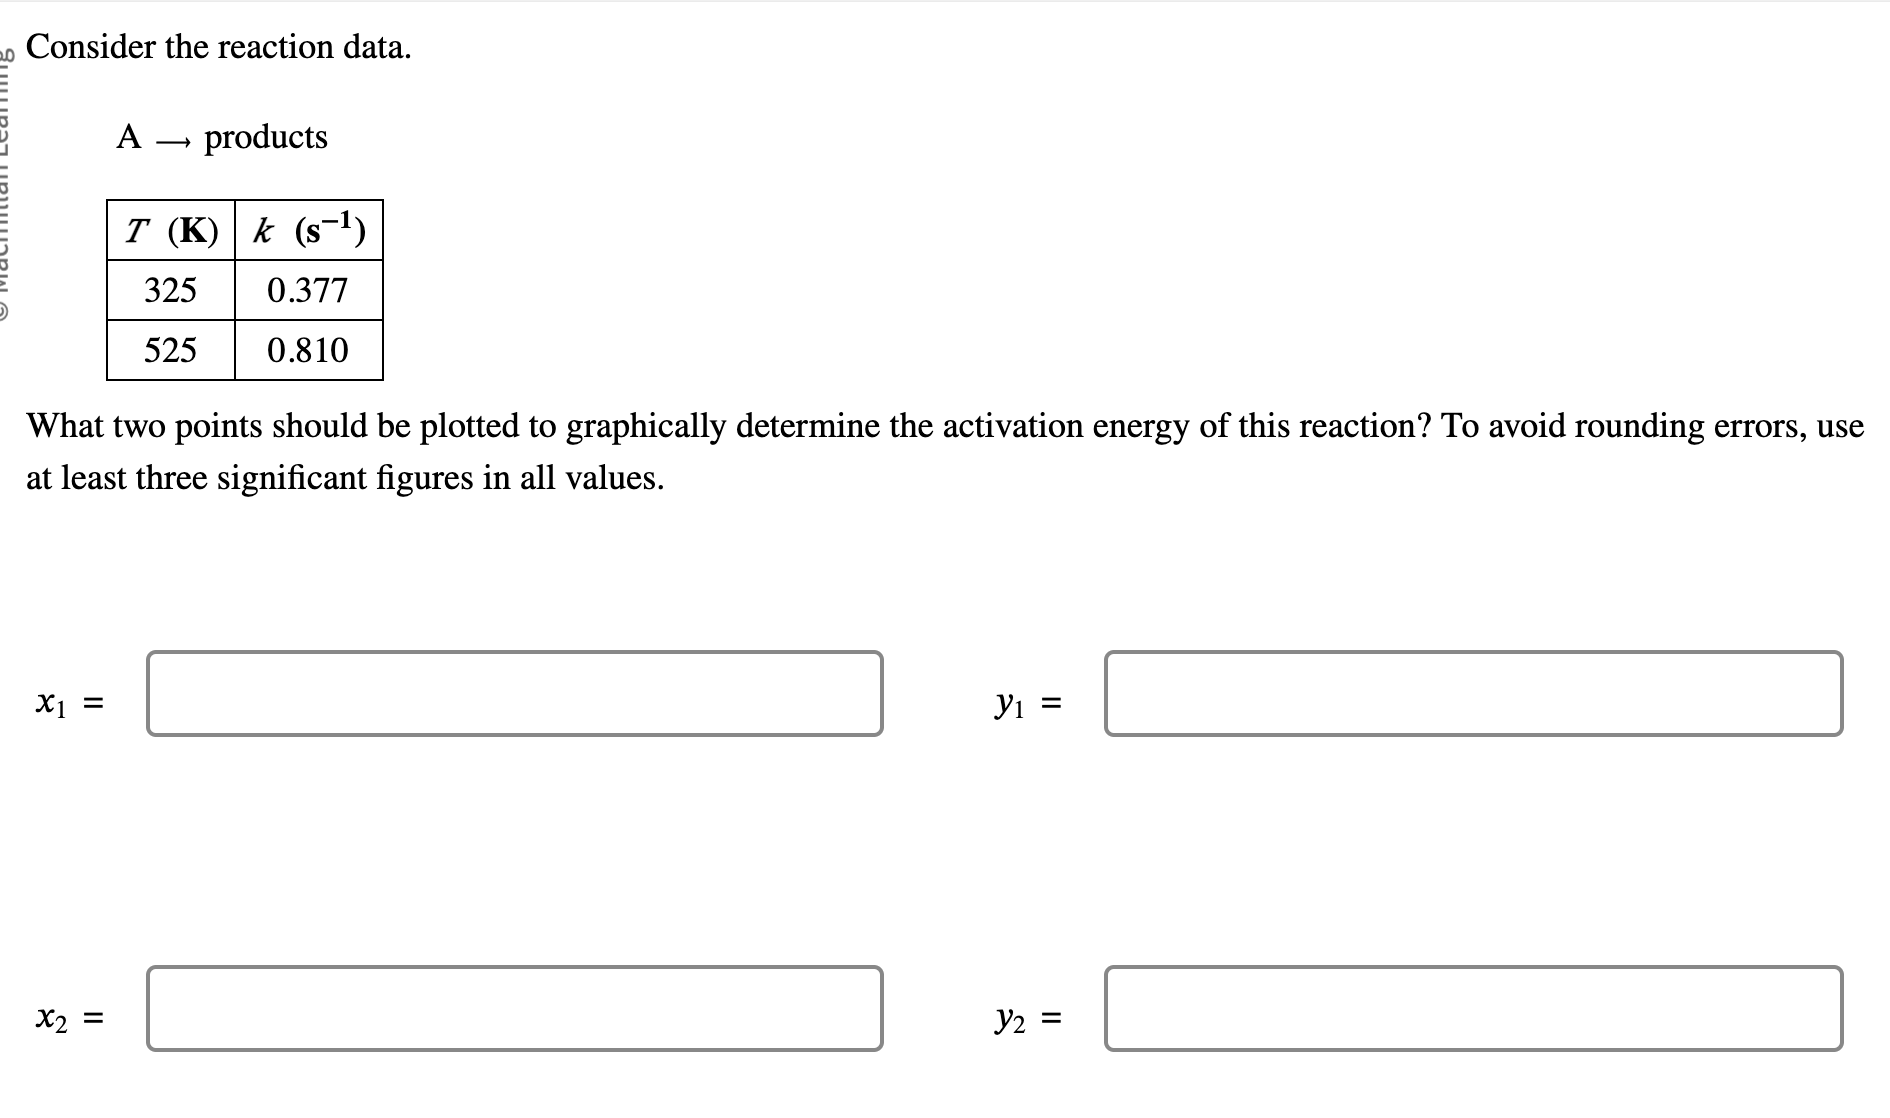
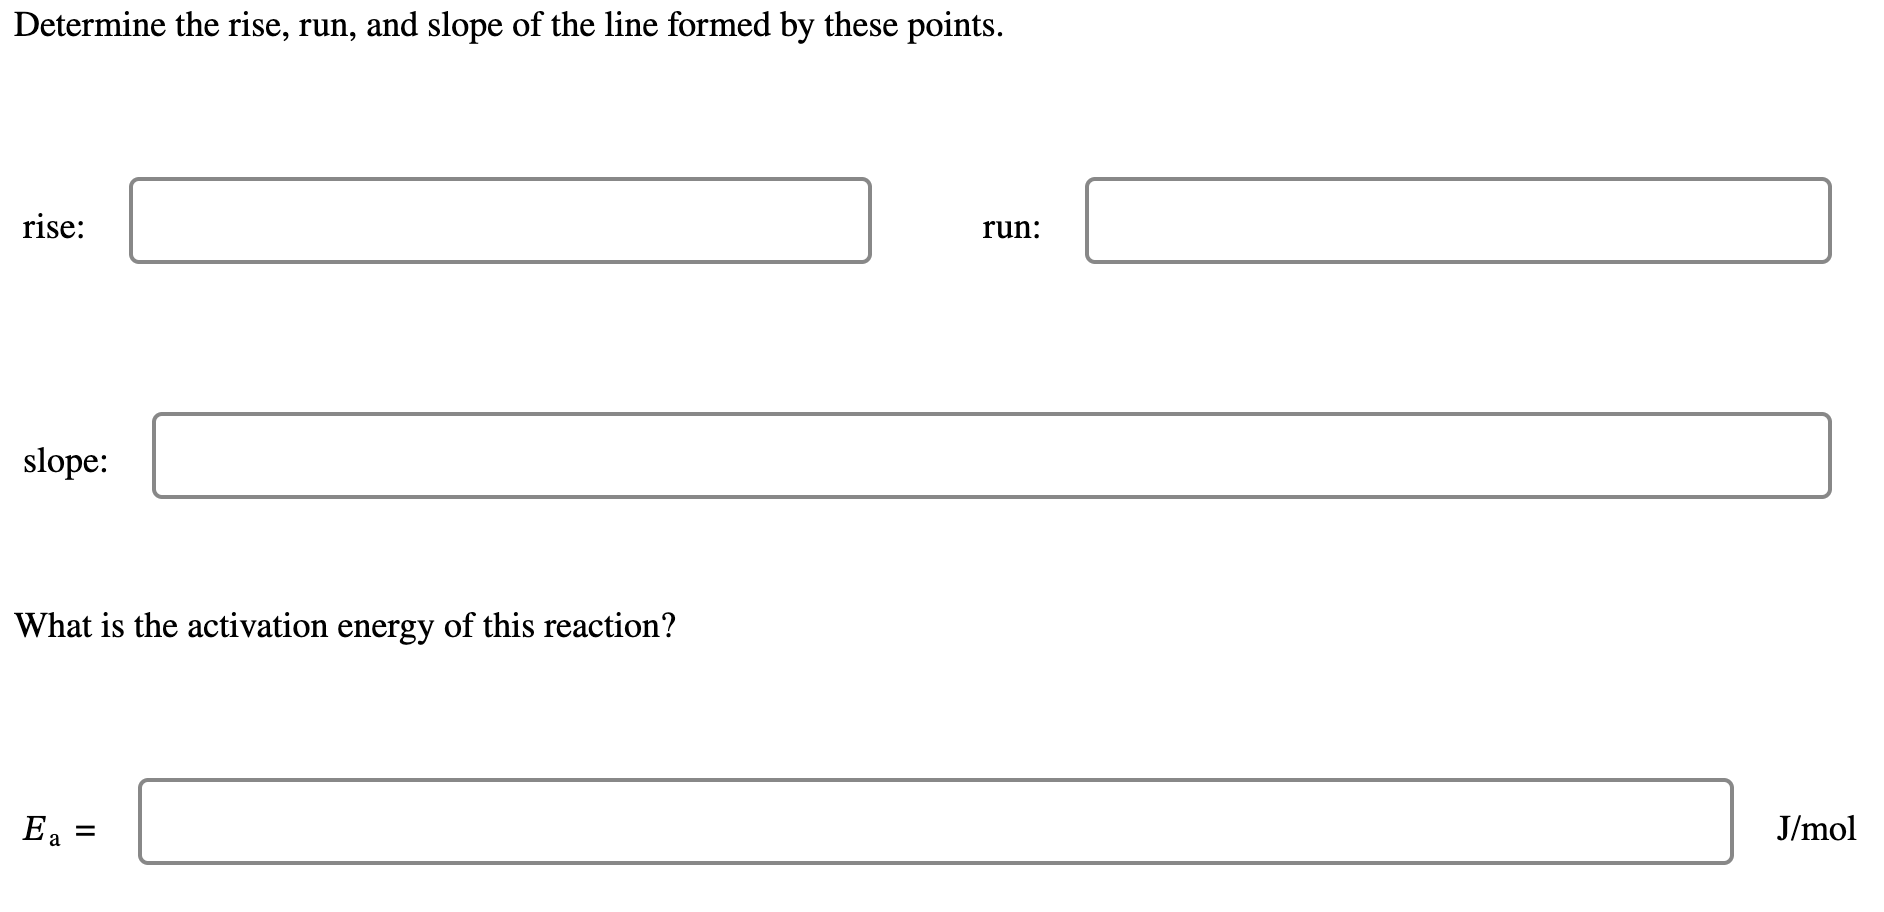
Consider the reaction data. A products What two points should be plotted to graphically determine the activation energy of this reaction? To avoid rounding errors, use at least three significant figures in all values. x1=y1= x2=y2= Determine the rise, run, and slope of the line formed by these points. rise: run: slope What is the activation energy of this reaction? Ea J/mol
Step by Step Solution
There are 3 Steps involved in it
1 Expert Approved Answer
Step: 1 Unlock

Question Has Been Solved by an Expert!
Get step-by-step solutions from verified subject matter experts
Step: 2 Unlock
Step: 3 Unlock