

Question: Consider the reaction data. What two points should be plotted to graphically determine the activation energy of this reaction? To avoid rounding errors, use
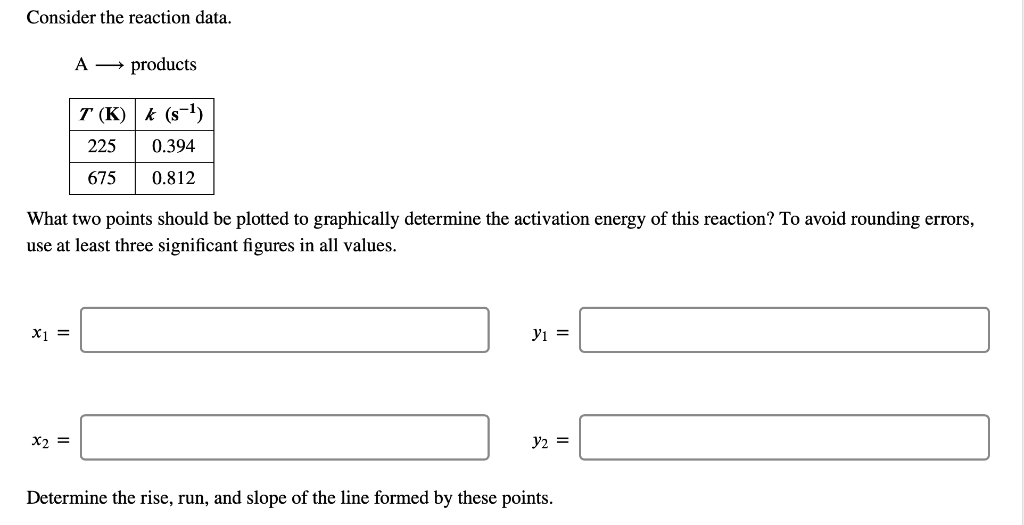
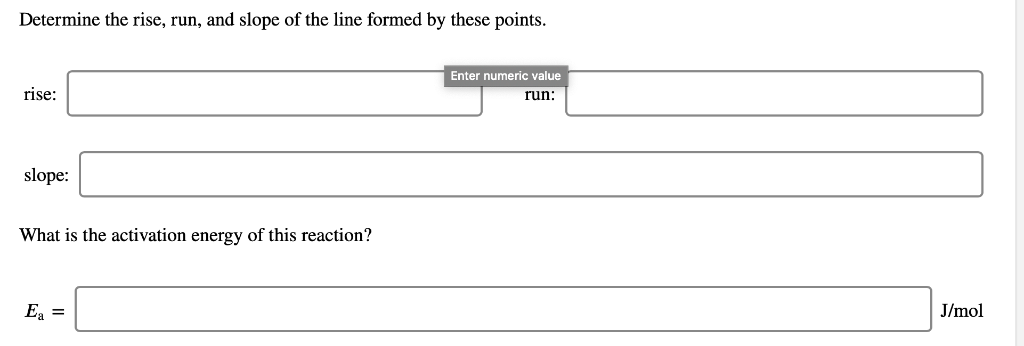
Consider the reaction data. What two points should be plotted to graphically determine the activation energy of this reaction? To avoid rounding errors, use at least three significant figures in all values. x1 = A products T (K) k (S-) 225 0.394 675 0.812 x2 = y1 = y = Determine the rise, run, and slope of the line formed by these points. Determine the rise, run, and slope of the line formed by these points. rise: slope: What is the activation energy of this reaction? Ea = Enter numeric value run: J/mol
Step by Step Solution
★★★★★
3.42 Rating (168 Votes )
There are 3 Steps involved in it
1 Expert Approved Answer
Step: 1 Unlock

Question Has Been Solved by an Expert!
Get step-by-step solutions from verified subject matter experts
Step: 2 Unlock
Step: 3 Unlock