

Question: Consider the scale-location plot below created from a simple linear regression model. What does the plot show? Scale-Location 819 926 O' O O O O
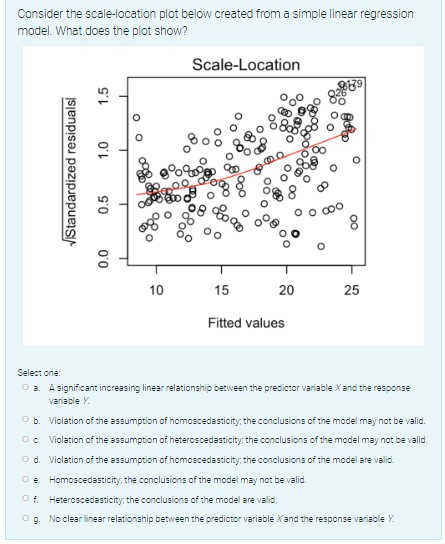
Consider the scale-location plot below created from a simple linear regression model. What does the plot show? Scale-Location 819 926 O' O O O O O 1. OO O O VIStandardized residuals O 00 O 8 0.5 08 20 0 0 COO O oo 0 0 O O 0.0 10 15 20 25 Fitted values Select one: Ofa. A significant increasing linear relationship between the predictor variable *and the response variable Y. Q b. Violation of the assumption of homoscedasticity; the conclusions of the model may not be valid. O c. Violation of the assumption of heteroscedasticity, the conclusions of the model may not be valid. Old. Violation of the assumption of homoscedasticity; the conclusions of the model are valid. Ole Homoscedasticity; the conclusions of the mode may not be valid. Of. Heteroscedasticity, the conclusions of the model are valid O g. No clear linear relationship between the predictor variable Xand the response variable )
Step by Step Solution
There are 3 Steps involved in it

Get step-by-step solutions from verified subject matter experts