

Question: Consider the scatterplot of two different graphs give below. Test 2 vs. Test 1 0 Test 2 0.734*x + 23 105 I 85 TestZ O
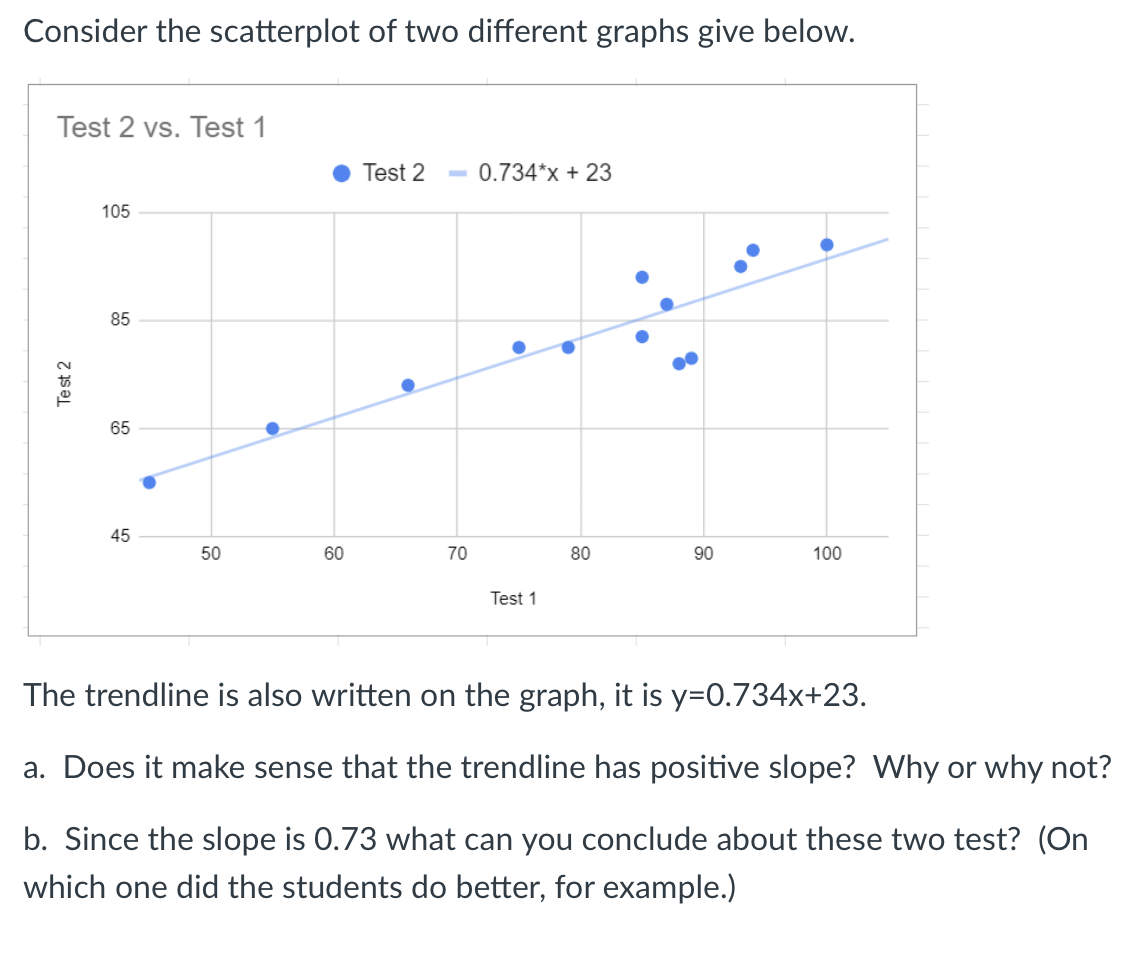
Consider the scatterplot of two different graphs give below. Test 2 vs. Test 1 0 Test 2 0.734*x + 23 105 I 85 TestZ O 65 o' 45 50 60 70 80 90 100 Test 1 The trendline is also written on the graph, it is y=0.734x+23. a. Does it make sense that the trendline has positive slope? Why or why not? b. Since the slope is 0.73 what can you conclude about these two test? (On which one did the students do better, for example.)
Step by Step Solution
There are 3 Steps involved in it
1 Expert Approved Answer
Step: 1 Unlock

Question Has Been Solved by an Expert!
Get step-by-step solutions from verified subject matter experts
Step: 2 Unlock
Step: 3 Unlock