

Question: Consider the shaded area below the graph of the function y = m2 + 1, above the m-axis and between the lines a: = 1
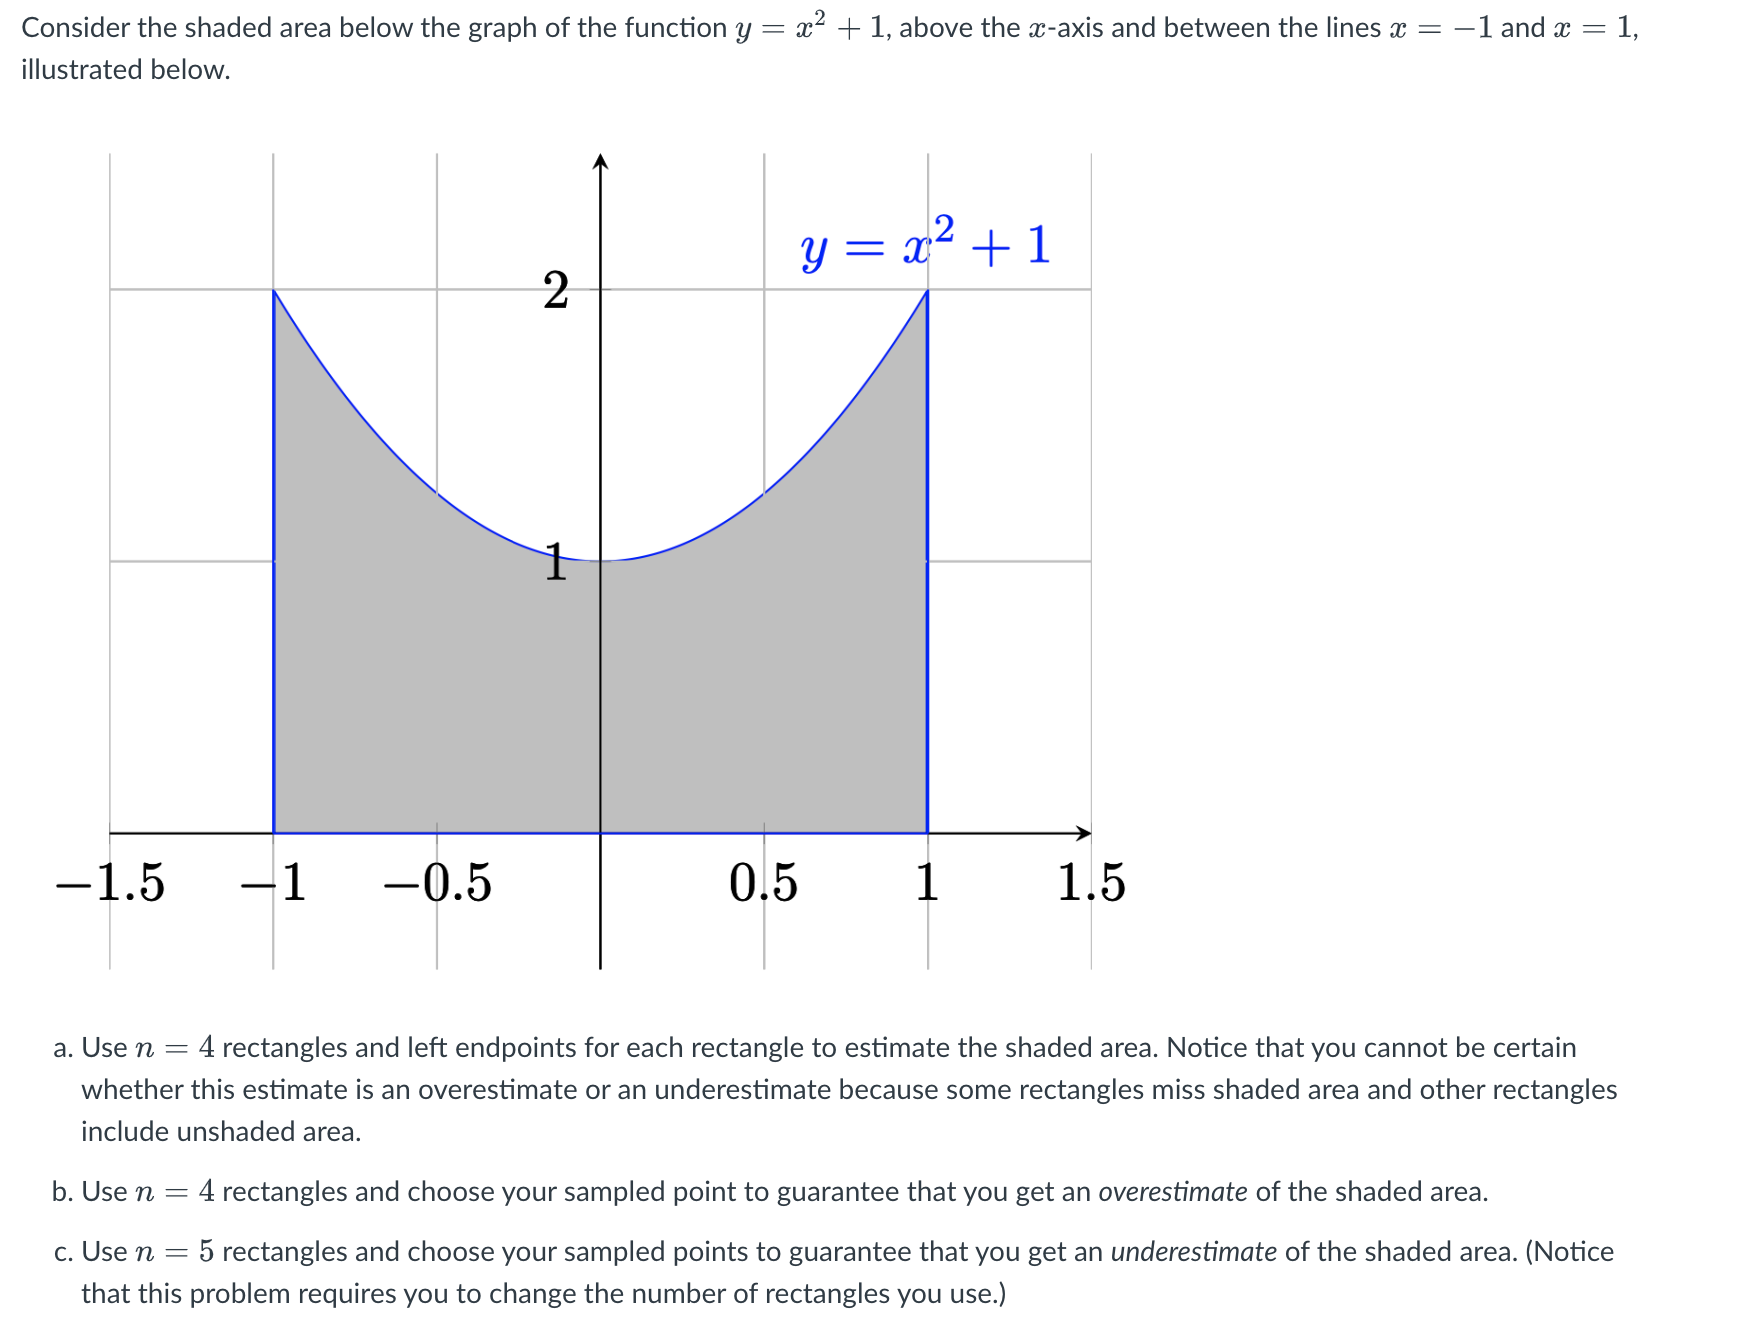

Consider the shaded area below the graph of the function y = m2 + 1, above the m-axis and between the lines a: = 1 and x = 1, illustrated below. a. Use 17, : 4 rectangles and left endpoints for each rectangle to estimate the shaded area. Notice that you cannot be certain whether this estimate is an overestimate or an underestimate because some rectangles miss shaded area and other rectangles include unshaded area. b. Use n = 4 rectangles and choose your sampled point to guarantee that you get an overestimate of the shaded area. c. Use '11 = 5 rectangles and choose your sampled points to guarantee that you get an underestimate of the shaded area. (Notice that this problem requires you to change the number of rectangles you use.)
Step by Step Solution
There are 3 Steps involved in it

Get step-by-step solutions from verified subject matter experts