

Question: Consider the six data points given in the table below. 1.5 1.9 6 Xi Yi 1 2 2 E = 0.005 2.3 10 2.6
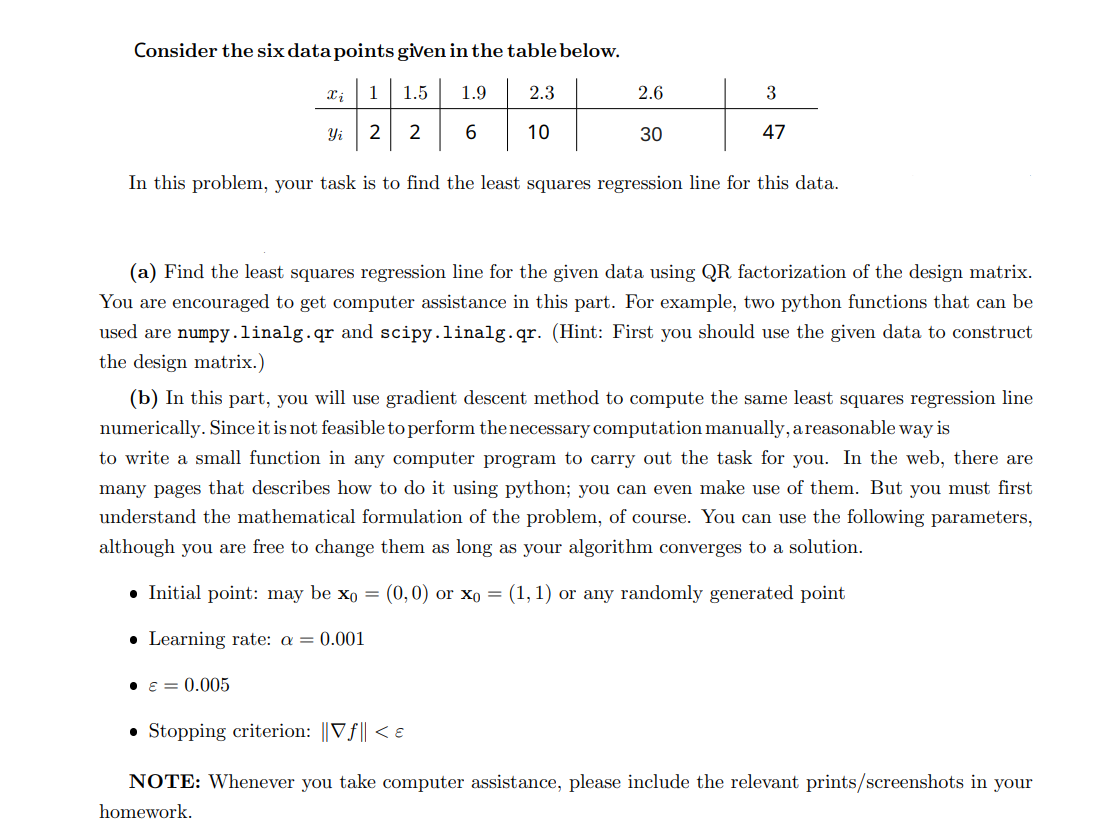
Consider the six data points given in the table below. 1.5 1.9 6 Xi Yi 1 2 2 E = 0.005 2.3 10 2.6 30 3 47 In this problem, your task is to find the least squares regression line for this data. (a) Find the least squares regression line for the given data using QR factorization of the design matrix. You are encouraged to get computer assistance in this part. For example, two python functions that can be used are numpy.linalg.qr and scipy.linalg.qr. (Hint: First you should use the given data to construct the design matrix.) (b) In this part, you will use gradient descent method to compute the same least squares regression line numerically. Since it is not feasible to perform the necessary computation manually, a reasonable way is to write a small function in any computer program to carry out the task for you. In the web, there are many pages that describes how to do it using python; you can even make use of them. But you must first understand the mathematical formulation of the problem, of course. You can use the following parameters, although you are free to change them as long as your algorithm converges to a solution. Initial point: may be xo = (0, 0) or Xo = (1, 1) or any randomly generated point Learning rate: a = 0.001 Stopping criterion: ||Vf|| < NOTE: Whenever you take computer assistance, please include the relevant prints/screenshots in your homework.
Step by Step Solution
3.38 Rating (157 Votes )
There are 3 Steps involved in it
a To find the least squares regression line using QR factorization of the design matrix we need to c... View full answer

Get step-by-step solutions from verified subject matter experts